
Monitoring your HPC cluster with OKA Healthcheck rules
Knowing your cluster's cost, energy consumption, and carbon footprint is valuable, but only if someone is watching. A cost overrun that nobody notices until the end of the month is not a monitoring failure; it is a monitoring gap. The data was there, the metric was computable, but no automated process was continuously checking whether the numbers had crossed a meaningful threshold.
OKA, developed by UCit, is an all-in-one HPC analytics platform that ships with over 20 native dashboards covering resource utilization, user behavior, job efficiency, sustainability reporting, and cost tracking. In the Data Enhancers article, we showed how Data Enhancers fill those dashboards with metrics that do not come out of the scheduler: energy readings from EAR, carbon footprint per job from the electricity grid, internal cost figures from your pricing model. That enrichment is the foundation.
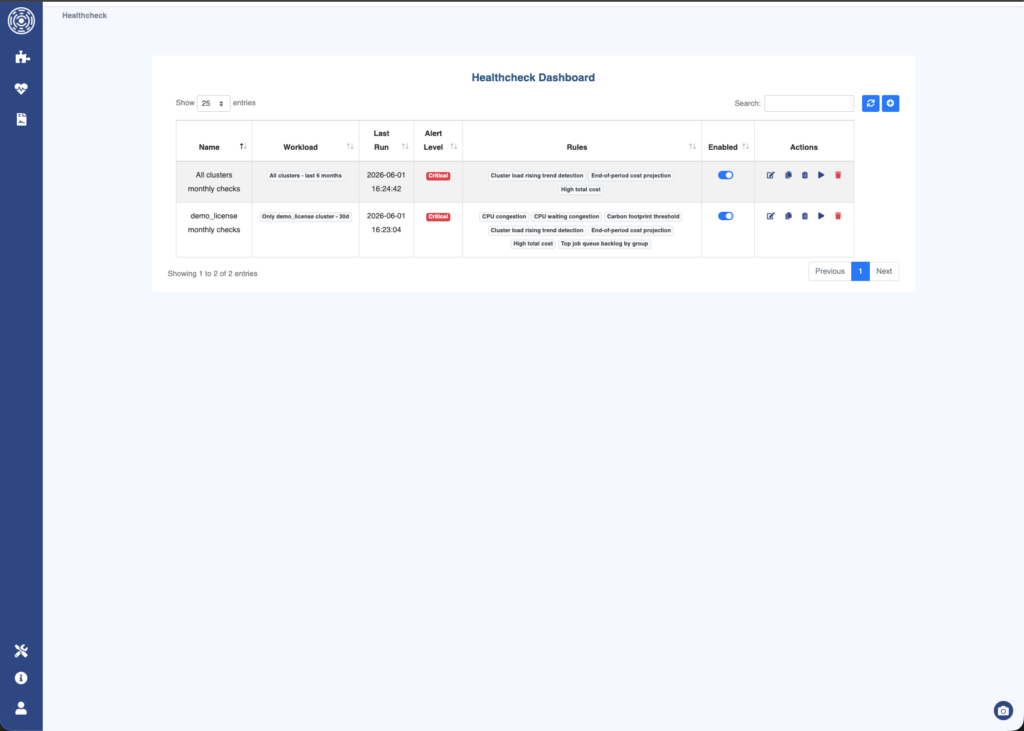
This article is about what you build on top of it: Healthcheck Rules. A Healthcheck Rule is a Python script that runs inside OKA on a configurable schedule, inspects a set of cluster metrics for the configured workload, and emits structured alerts when something is wrong (or trending toward wrong). Rules are not dashboards you read periodically; they are automated observers that fire the moment a threshold is crossed, regardless of whether anyone is looking at OKA at that moment.
The source code for all rules discussed will be available in the
oka_healthcheckrepository.
Anatomy of a Healthcheck Rule
Before walking through specific examples, it is worth understanding what a Healthcheck Rule looks like and how OKA manages it. The pattern will feel familiar if you read the Data Enhancers article: it is the same Pydantic-first, single-file design philosophy applied to monitoring instead of data enrichment.
At its core, a Healthcheck Rule is a Python class that inherits from HealthcheckRule (a generic base class provided by OKA) and implements a single evaluate method. The method returns a list of Alert objects (one per anomaly detected) or an empty list when everything is within bounds.
from pydantic import BaseModel, Field
from applications.ait.enums import ResultStatus
from applications.healthcheck.core import Alert, HealthcheckRule
from applications.healthcheck.models import AlertLevel

class MyRuleParams(BaseModel):
    threshold: float = Field(
        default=0.80,
        ge=0.0,
        le=1.0,
        description="Core utilization fraction above which HIGH is triggered.",
    )

class MyRule(HealthcheckRule[MyRuleParams]):
    params_model = MyRuleParams

    def evaluate(self) -> list[Alert]:
        load, status = self.cluster_load.get_core_load()
        if status != ResultStatus.OK or load is None:
            return []
        if load.utilization_rate < self.params.threshold:
            return []
        return [Alert(
            level=AlertLevel.HIGH,
            title=f"Core utilization at ",
            description="Utilization exceeded the configured threshold.",
            reason=f"Utilization  exceeded threshold .",
            metadata=,
)]A few things are worth noting:
- Pydantic for parameters. The
params_modelclass declares every tunable parameter with its type, default, and validation rules. OKA reads these in the admin panel and exposes them as a form, so operators can adjust thresholds without touching code. - One file, no package. Each rule lives in a single
.pyfile, just like Data Enhancers. No packaging, no imports outside of what OKA provides. - Data providers as properties. The base class exposes cluster metrics through lazy-loaded properties:
self.cluster_loadgives access to cost, core utilization, and GPU load;self.stategives aggregated job state counts;self.job_frequencyprovides submission frequency grouped by account or partition. Rules never query Elasticsearch or the database directly: the provider layer handles all of that. - Five alert severity levels.
AlertLevelis an ordered enum:OK,LOW,MEDIUM,HIGH,CRITICAL.OKis used for informational returns when the data provider returns no data, rather than silent absence. The others map to increasingly urgent conditions.
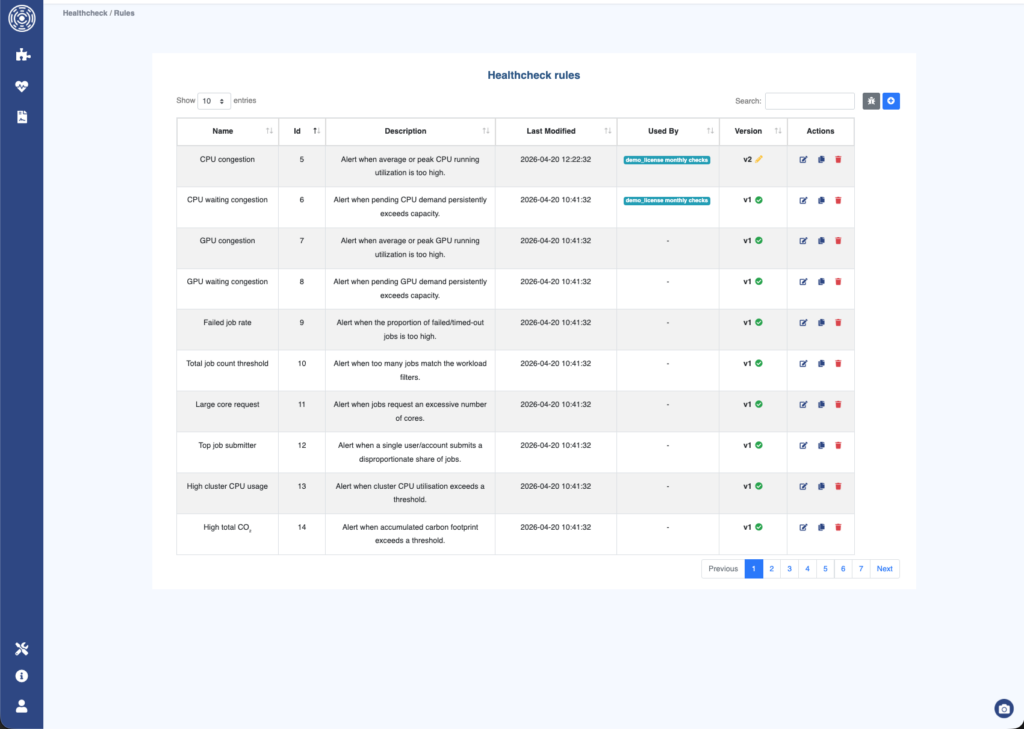
Deploying a rule through the OKA UI. The workflow mirrors the Data Enhancer deployment cycle:
- Create — navigate to Management → Healthcheck Rules, click "Create", and write or paste your Python code into the integrated editor (CodeMirror with syntax highlighting and
.pyfile import). The first save creates a draft. - Test in the sandbox — run the draft against a real workload to inspect the alerts it would produce before it becomes active. Logs and any exceptions are visible alongside the output.
- Publish — creates an immutable, timestamped version. No server restart required.
- Assign to a Healthcheck — a Healthcheck is the configuration entity that binds a workload scope (cluster, partition, account filter), one or more rules, a schedule, and a notification profile. Published rules appear in the assignment dropdown and can be shared across any number of healthchecks, each with independent parameter overrides.
Versioning and auditability. Published versions are immutable. Editing a published rule always creates a new draft; the active assignments continue using their pinned version until you explicitly update them. This guarantees that every alert in the history is traceable to the exact rule logic that produced it: which formula, which thresholds, which data source.
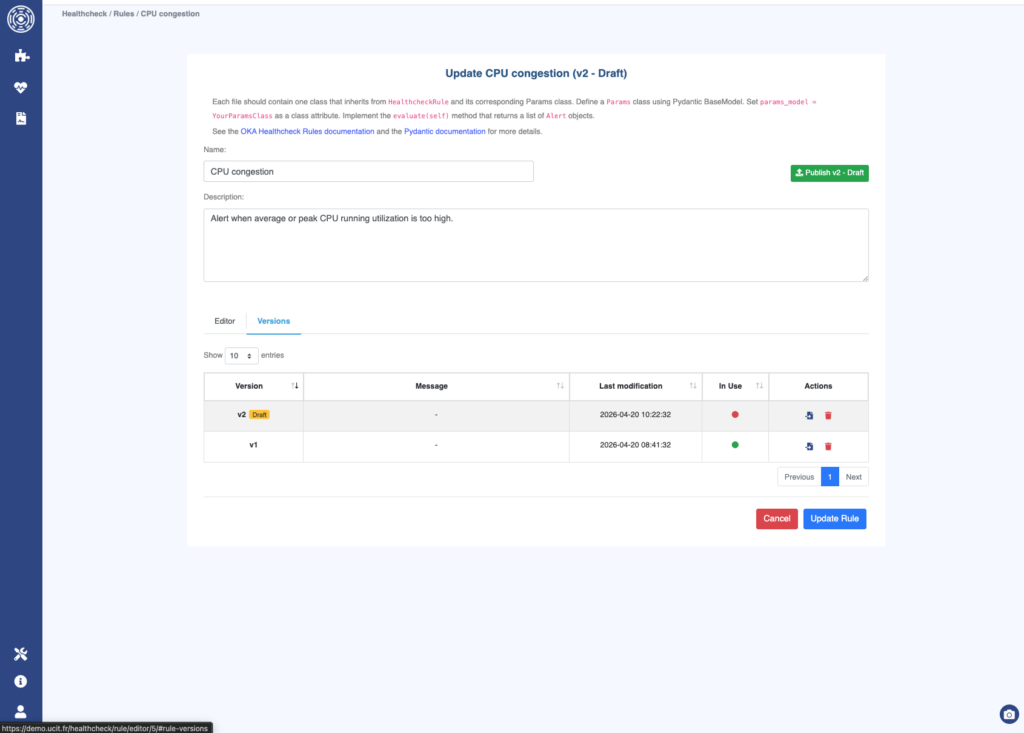
Full documentation is available at doc.oka.how under the admin guide → Healthcheck Rules section.
The Rules – A use case tour
Financial Monitoring: Budget Thresholds and Cost Forecasting
Cost visibility is one of the most requested capabilities from HPC finance teams. The two rules below address the same concern from different angles: one reacts to spending that has already occurred; the other projects where spending is headed before the period ends.
Reacting to observed spend: CostThresholdRule
The simplest budget rule compares cumulative cost to a configured budget and fires at three milestones. Three severity tiers are appropriate here: an early warning at 70 %, a firm alert at 90 %, and a critical breach at 100 % or beyond.
class Params(BaseModel):
    budget: float = Field(
        default=10000.0, gt=0.0,
        description="Total budget for the workload period (in cluster currency).",
    )
    warn_pct: float = Field(
        default=0.70, ge=0.0, le=1.0,
        description="Fraction of budget that triggers a LOW alert (default 70%).",
    )
    high_pct: float = Field(
        default=0.90, ge=0.0, le=1.0,
        description="Fraction of budget that triggers a HIGH alert (default 90%).",
    )
    critical_pct: float = Field(
        default=1.00, ge=0.0,
        description="Fraction of budget that triggers a CRITICAL alert (default 100%).",
)The evaluate method fetches the daily cost time-series and computes total_cost / budget. The level-resolution helper checks thresholds from most-severe to least-severe — a detail that matters when consumption is above 100 %:
def _resolve_alert_level(self, consumption: float) -> tuple[AlertLevel, float] | None:
    if consumption >= self.params.critical_pct:
        return AlertLevel.CRITICAL, self.params.critical_pct
    if consumption >= self.params.high_pct:
        return AlertLevel.HIGH, self.params.high_pct
    if consumption >= self.params.warn_pct:
        return AlertLevel.LOW, self.params.warn_pct
return NoneChecking most-severe first ensures that a 105 % consumption is classified as CRITICAL, not caught by the 70 % LOW guard.
Why this matters. Budget milestones are not binary. A team that only hears about cost at 100 % has no room to adjust. Surfacing a LOW alert at 70 % gives finance teams two weeks' warning on a monthly budget; the HIGH at 90 % triggers a conversation; the CRITICAL at 100 % (or beyond) requires immediate action. Three thresholds, one rule, no polling.
Projecting future spend: CostProjectionRule
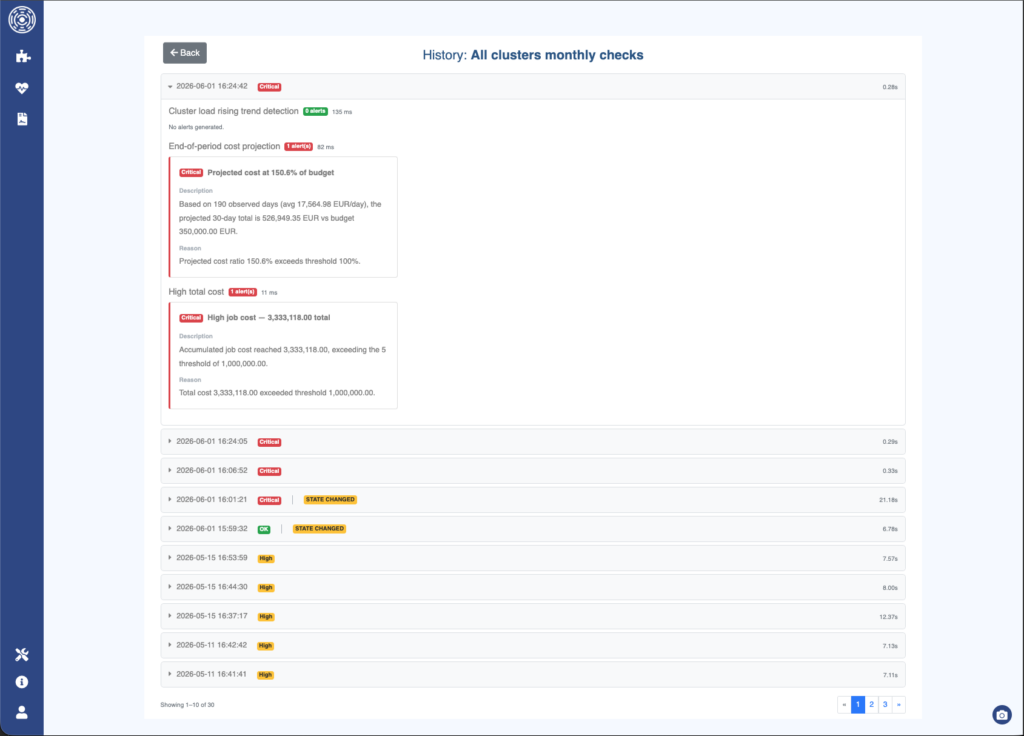
The threshold rule reacts to what has already been spent. The projection rule asks where the final total will land if the current spending rate continues:
class Params(BaseModel):
    budget: float = Field(default=10000.0, gt=0.0)
    period_days: int = Field(
        default=30, ge=1,
        description="Length of the billing period in days.",
    )
    warn_pct: float = Field(
        default=0.90,
        description="Projected fraction of budget that triggers HIGH (default 90%).",
    )
    critical_pct: float = Field(
        default=1.00,
        description="Projected fraction of budget that triggers CRITICAL (default 100%).",
    )
    min_days: int = Field(
        default=3, ge=1,
        description="Minimum observed days before projection is considered reliable.",
)The projection itself is a straightforward linear extrapolation: observed daily average multiplied by the total period length:
def _project_total(self, daily_values: list, total_days: int) -> float:
    if not daily_values or total_days <= 0:
        return 0.0
    avg_daily = sum(daily_values) / len(daily_values)
return avg_daily * total_daysThe min_days guard is a practical safeguard: a projection on day 1 of a 30-day period is not reliable enough to act on. The rule stays silent until enough data has accumulated, then fires as soon as the linear forecast crosses the configured budget fraction.
Why this matters. A cluster on track to spend 120 % of its monthly budget will not trigger a threshold alert until it actually crosses 70 %, by day 21 of 30, at best. The projection rule fires at day 10, early enough to reschedule low-priority workloads, negotiate a budget extension, or inform the finance team before the invoice arrives. One rule reacts to the past; the other changes the future.
Sustainability: Carbon footprint dominance
Once jobs carry a CO2 column, populated by the carbon footprint Data Enhancer, it becomes possible to monitor not just total emissions but their distribution across accounts and partitions. A cluster-level carbon report that shows 78 % of emissions coming from a single account is a very different finding from one where the footprint is spread evenly.
TopCo2EmitterRule
This rule fetches CO₂ data grouped by a configurable key and fires when a single group exceeds a configurable share of the combined footprint:
class Params(BaseModel):
    grouping_key: str = Field(
        default="Account",
        description="Field to group by (e.g. 'Account', 'Partition').",
    )
    grouping_size: int = Field(
        default=10, ge=1,
        description="Number of top groups to analyse.",
    )
    dominance_high: float = Field(
        default=0.50,
        description="Fraction of combined CO₂ by a single group that triggers HIGH.",
    )
    dominance_critical: float = Field(
        default=0.75,
        description="Fraction of combined CO₂ by a single group that triggers CRITICAL.",
)The evaluate method sums the CO₂ averages across all returned groups and evaluates each one independently:
total_co2 = sum(group.avg_running for group in grouped.groups)

for group in grouped.groups:
    share = group.avg_running / total_co2
    if share >= self.params.dominance_critical:
        level, threshold = AlertLevel.CRITICAL, self.params.dominance_critical
    elif share >= self.params.dominance_high:
        level, threshold = AlertLevel.HIGH, self.params.dominance_high
    else:
        continue
# build alert with group name, share, avg and peak CO₂...The same rule can be run twice on the same cluster, once grouped by Account to identify which research group is the largest emitter, and once grouped by Partition to identify which hardware segment is most carbon-intensive, each with independent thresholds.
Why this matters. Aggregate CO₂ figures satisfy reporting requirements. Grouped CO₂ figures with automated dominance alerts enable action. When a single account consistently represents more than half the cluster's carbon footprint, that is the conversation to have: whether the fix is scheduling policy, hardware allocation, or job optimization. The rule surfaces that conversation automatically, rather than waiting for someone to investigate a dashboard at the right moment.
Operational Health: Failure rates and submission anomalies
Financial and sustainability metrics are important, but the most immediate signals for an HPC operations team are usually operational: jobs failing at an unusual rate, a single account flooding the scheduler, a partition that has gone silent. The two rules below cover the two most common early-warning signals.
Detecting job failure spikes: JobFailureRateRule
This rule uses a pre-aggregated query that returns job counts grouped by state — far cheaper than streaming individual job documents on large clusters. The set of states that count as failures is defined once at module level, enabling O(1) membership tests across all state buckets:
_FAILURE_STATES = frozenset()The aggregation logic isolates both the total failed count and the list of active failure states: only states with a non-zero count, sorted alphabetically for consistent alert text:
def _compute_failure_counts(self, entries: list) -> tuple[float, list[str]]:
    failed = sum(entry.count for entry in entries if entry.state in _FAILURE_STATES)
    failing_states = sorted(
        entry.state.value
        for entry in entries
        if entry.state in _FAILURE_STATES and entry.count > 0
    )
return failed, failing_statesA min_jobs parameter (default: 10) prevents the rule from firing on near-empty evaluation windows where a single failure would produce a misleadingly high rate. The failing_states list in the alert metadata tells operators immediately whether they are looking at hardware failures (NODE_FAIL), memory issues (OUT_OF_MEMORY), or time-limit overruns (TIMEOUT) — without any additional investigation.
Why this matters. A burst of NODE_FAIL events at 03:00 that nobody sees until the morning standup is several hours of degraded throughput and frustrated users. A failure rate alert (configurable at 10 % for HIGH and 30 % for CRITICAL) fires the moment the cluster's health departs from normal, whether the on-call engineer is watching or not.
Detecting runaway submission loops: HighAccountJobCountRule
A scheduler under excessive submission load behaves poorly for everyone on the cluster. The cause is often not malicious: a misconfigured job array, a broken loop in a workflow script, or a benchmark accidentally left running at full scale. This rule identifies it before it causes visible degradation:
class Params(BaseModel):
    concentration_high: float = Field(
        default=0.60,
        description="Job submission share above which HIGH is triggered.",
    )
    concentration_critical: float = Field(
        default=0.80,
        description="Job submission share above which CRITICAL is triggered.",
    )
    min_total_jobs: int = Field(
        default=10, ge=1,
        description="Minimum total job count required before the rule fires.",
)The rule fetches per-account submission counts and deliberately excludes the "Others" overflow bucket — which aggregates small accounts and would otherwise distort the concentration calculation:
def _build_account_totals(self, groups: list) -> dict[str, int]:
    account_totals: dict[str, int] =
    for entry in groups:
        group = entry.get("group")
        job_count = entry.get("job_count")
        if group is None or group == "Others" or job_count is None:
            continue
        account_totals[group] = int(job_count.sum())
return account_totalsWhen the top account exceeds 60 % of all submitted jobs, a HIGH alert fires naming the account, its job count, and the total. That is enough information to contact the user or inspect the queue without further investigation.
Why this matters. A runaway submission loop can queue thousands of jobs in minutes. Catching it at 60 % concentration (before it saturates the scheduler) is the difference between a brief queue spike and a cluster-wide slowdown that affects every user.
From Alert to Notification: How OKA Delivers Results
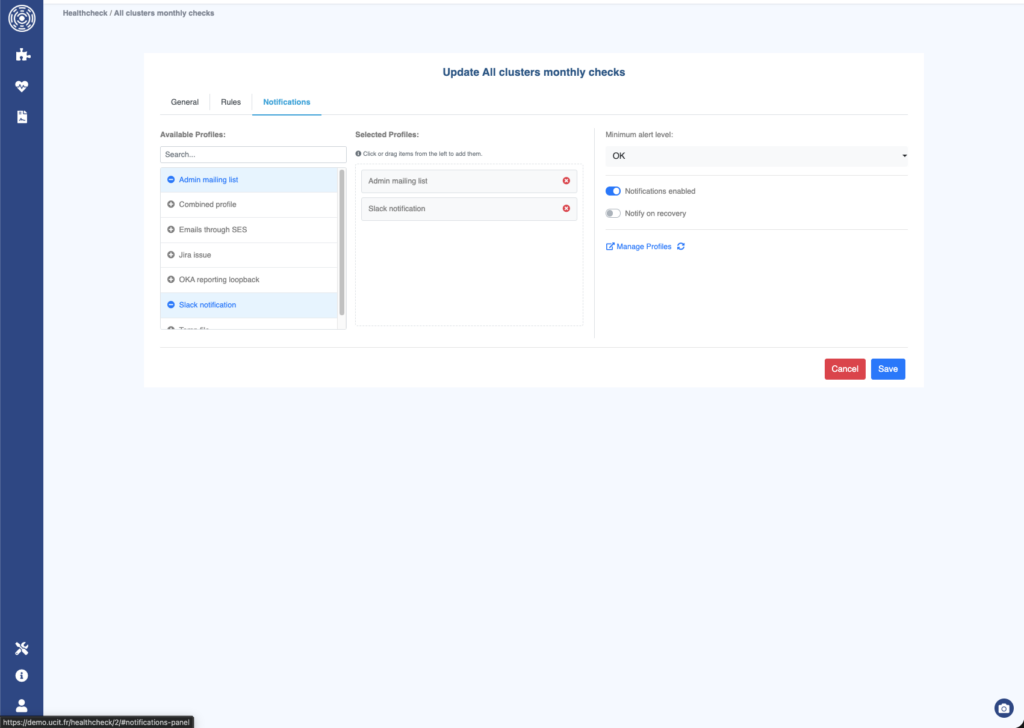
A rule that fires an alert inside OKA but never reaches anyone is indistinguishable from no rule at all. OKA's Notification Profiles, configured under Management → Notifications, connect one or more healthchecks to one or more delivery channels. A single profile can activate all three channel types simultaneously:
- Email — OKA delivers notifications directly via SMTP, with no external bridge required. Useful for reaching finance teams, management, or compliance stakeholders who are not using an ops tool. Each notification includes the alert subject and the full alert body as plain text.
- File — alert details are appended to a log file on the server. Zero dependencies, zero infrastructure, and immediately compatible with any log shipping pipeline (Loki, Elasticsearch, syslog). Useful for archiving a timestamped audit trail of every alert that fired.
- Webhook — OKA posts a structured JSON payload (
subject+body) to any HTTP endpoint you configure. The subject follows the pattern[OKA Healthcheck] :, giving downstream services everything they need to route, format, and act on the notification. This is the integration point for Slack, Jira, PagerDuty, automated PDF reports, or any custom target.
The key design point is that notification profiles are independent of the rules themselves. The same profile can be assigned to a dozen healthchecks; a single healthcheck can fire into multiple channels simultaneously. Delivery configuration is separated from detection logic: you can tighten or loosen notification sensitivity per channel without touching rule code.
Conclusion: Automate the watch
Healthcheck Rules are the layer that turns OKA from a platform you visit into one that comes to you. The five rules in this article cover the most common monitoring needs we encounter at HPC centers:
- CostThresholdRule — three-tier budget milestone alerts (LOW / HIGH / CRITICAL) on observed spend.
- CostProjectionRule — forward-looking spend forecast that fires before overspend actually occurs.
- TopCo2EmitterRule — carbon footprint dominance detection by account or partition, dependent on the CO₂ data enriched in the first article.
- JobFailureRateRule — aggregated failure-state detection with a configurable minimum job count guard.
- HighAccountJobCountRule — runaway submission detection with fairshare concentration thresholds.
Each rule is a single .py file. Paste it into the OKA admin panel, test it against a real workload in the sandbox, publish it, and assign it to a healthcheck with a schedule and a notification profile. No infrastructure to manage, no server to restart, no deployment pipeline to configure.
Getting started follows the same pattern for every rule:
- Browse the repository and identify the rule closest to your use case.
- Open Management → Healthcheck Rules in OKA and paste the code into the integrated editor.
- Test in the sandbox against a real workload, then publish the draft.
- Create or update a Healthcheck to assign the rule with your desired schedule and notification profile.
The collection grows through the experience of teams running real clusters. If you write a rule that detects something specific to your environment (GPU idle rate, license checkout failures, partition fairshare drift) consider contributing it back. A well-documented rule you share today might save another HPC team days of investigation tomorrow.
OKA monitors your cluster. Healthcheck Rules make sure that monitoring actually matters.
Questions, feature requests, or contributions? Open an issue or a pull request in the
oka_healthcheckrepository, or contact the UCit team.