


You can try OKA Core for free now.


OKA addresses HPC’s most common pain points
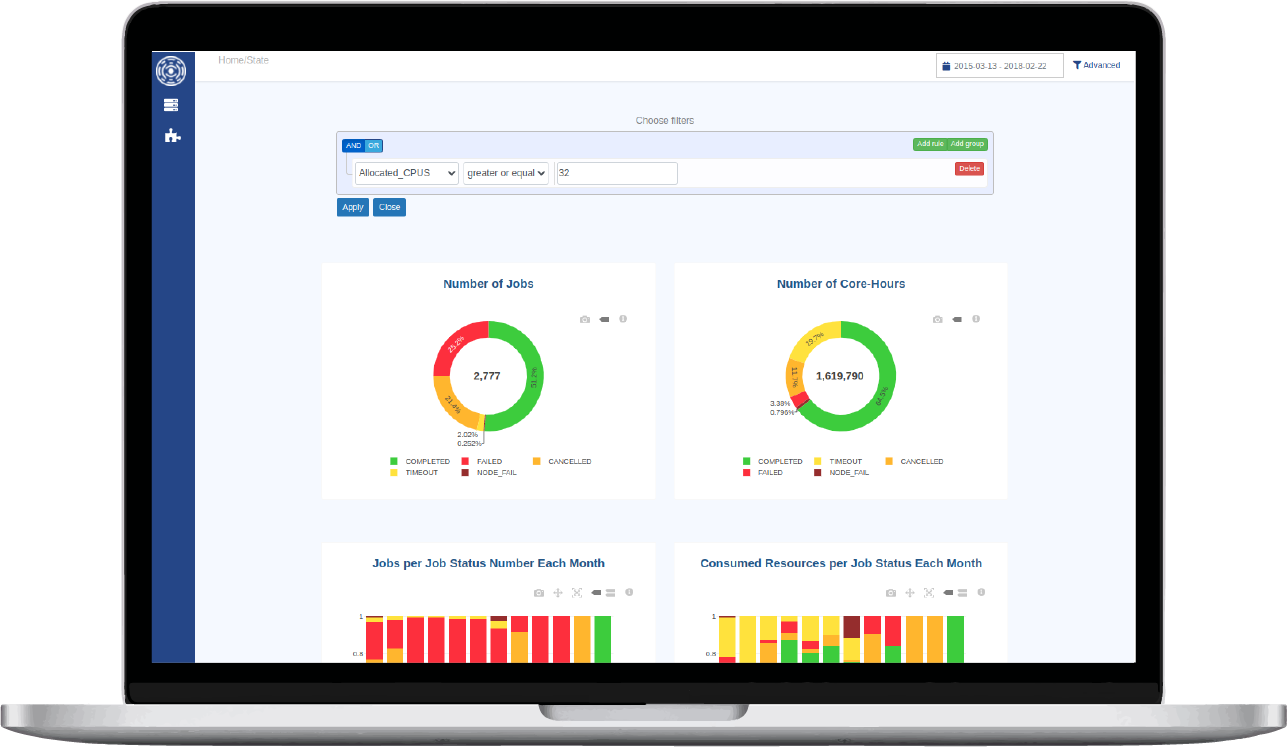
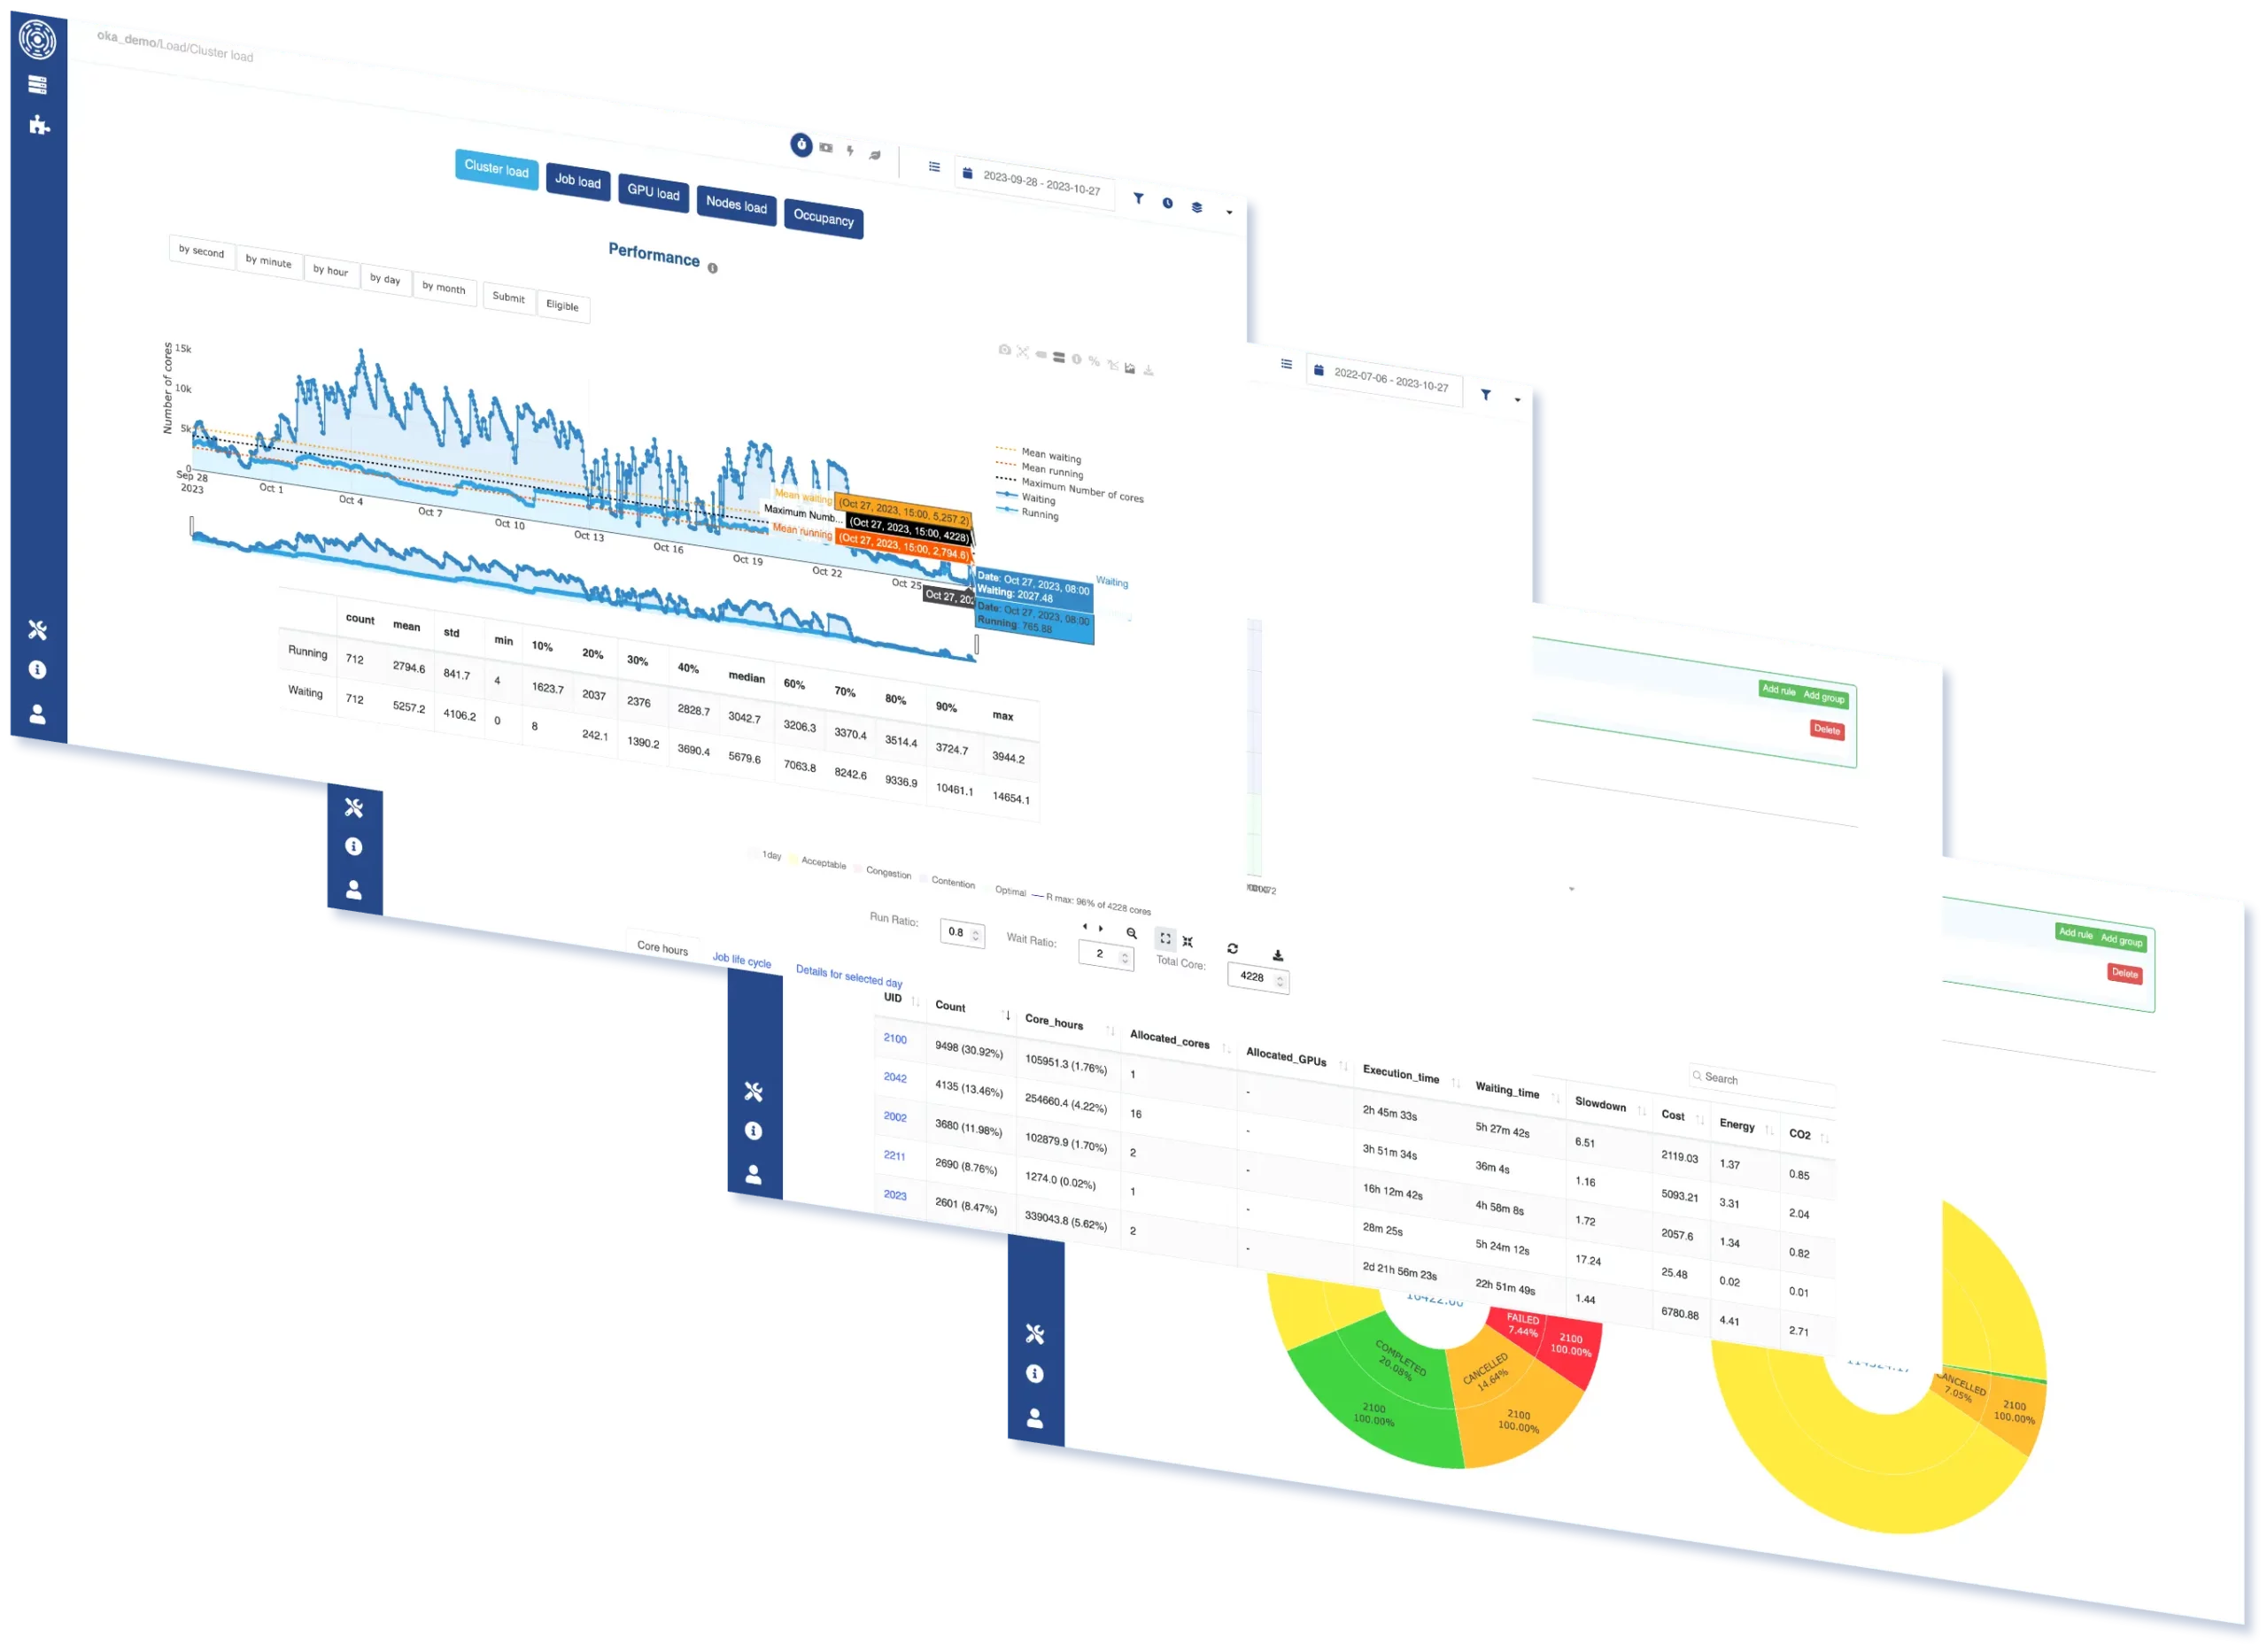
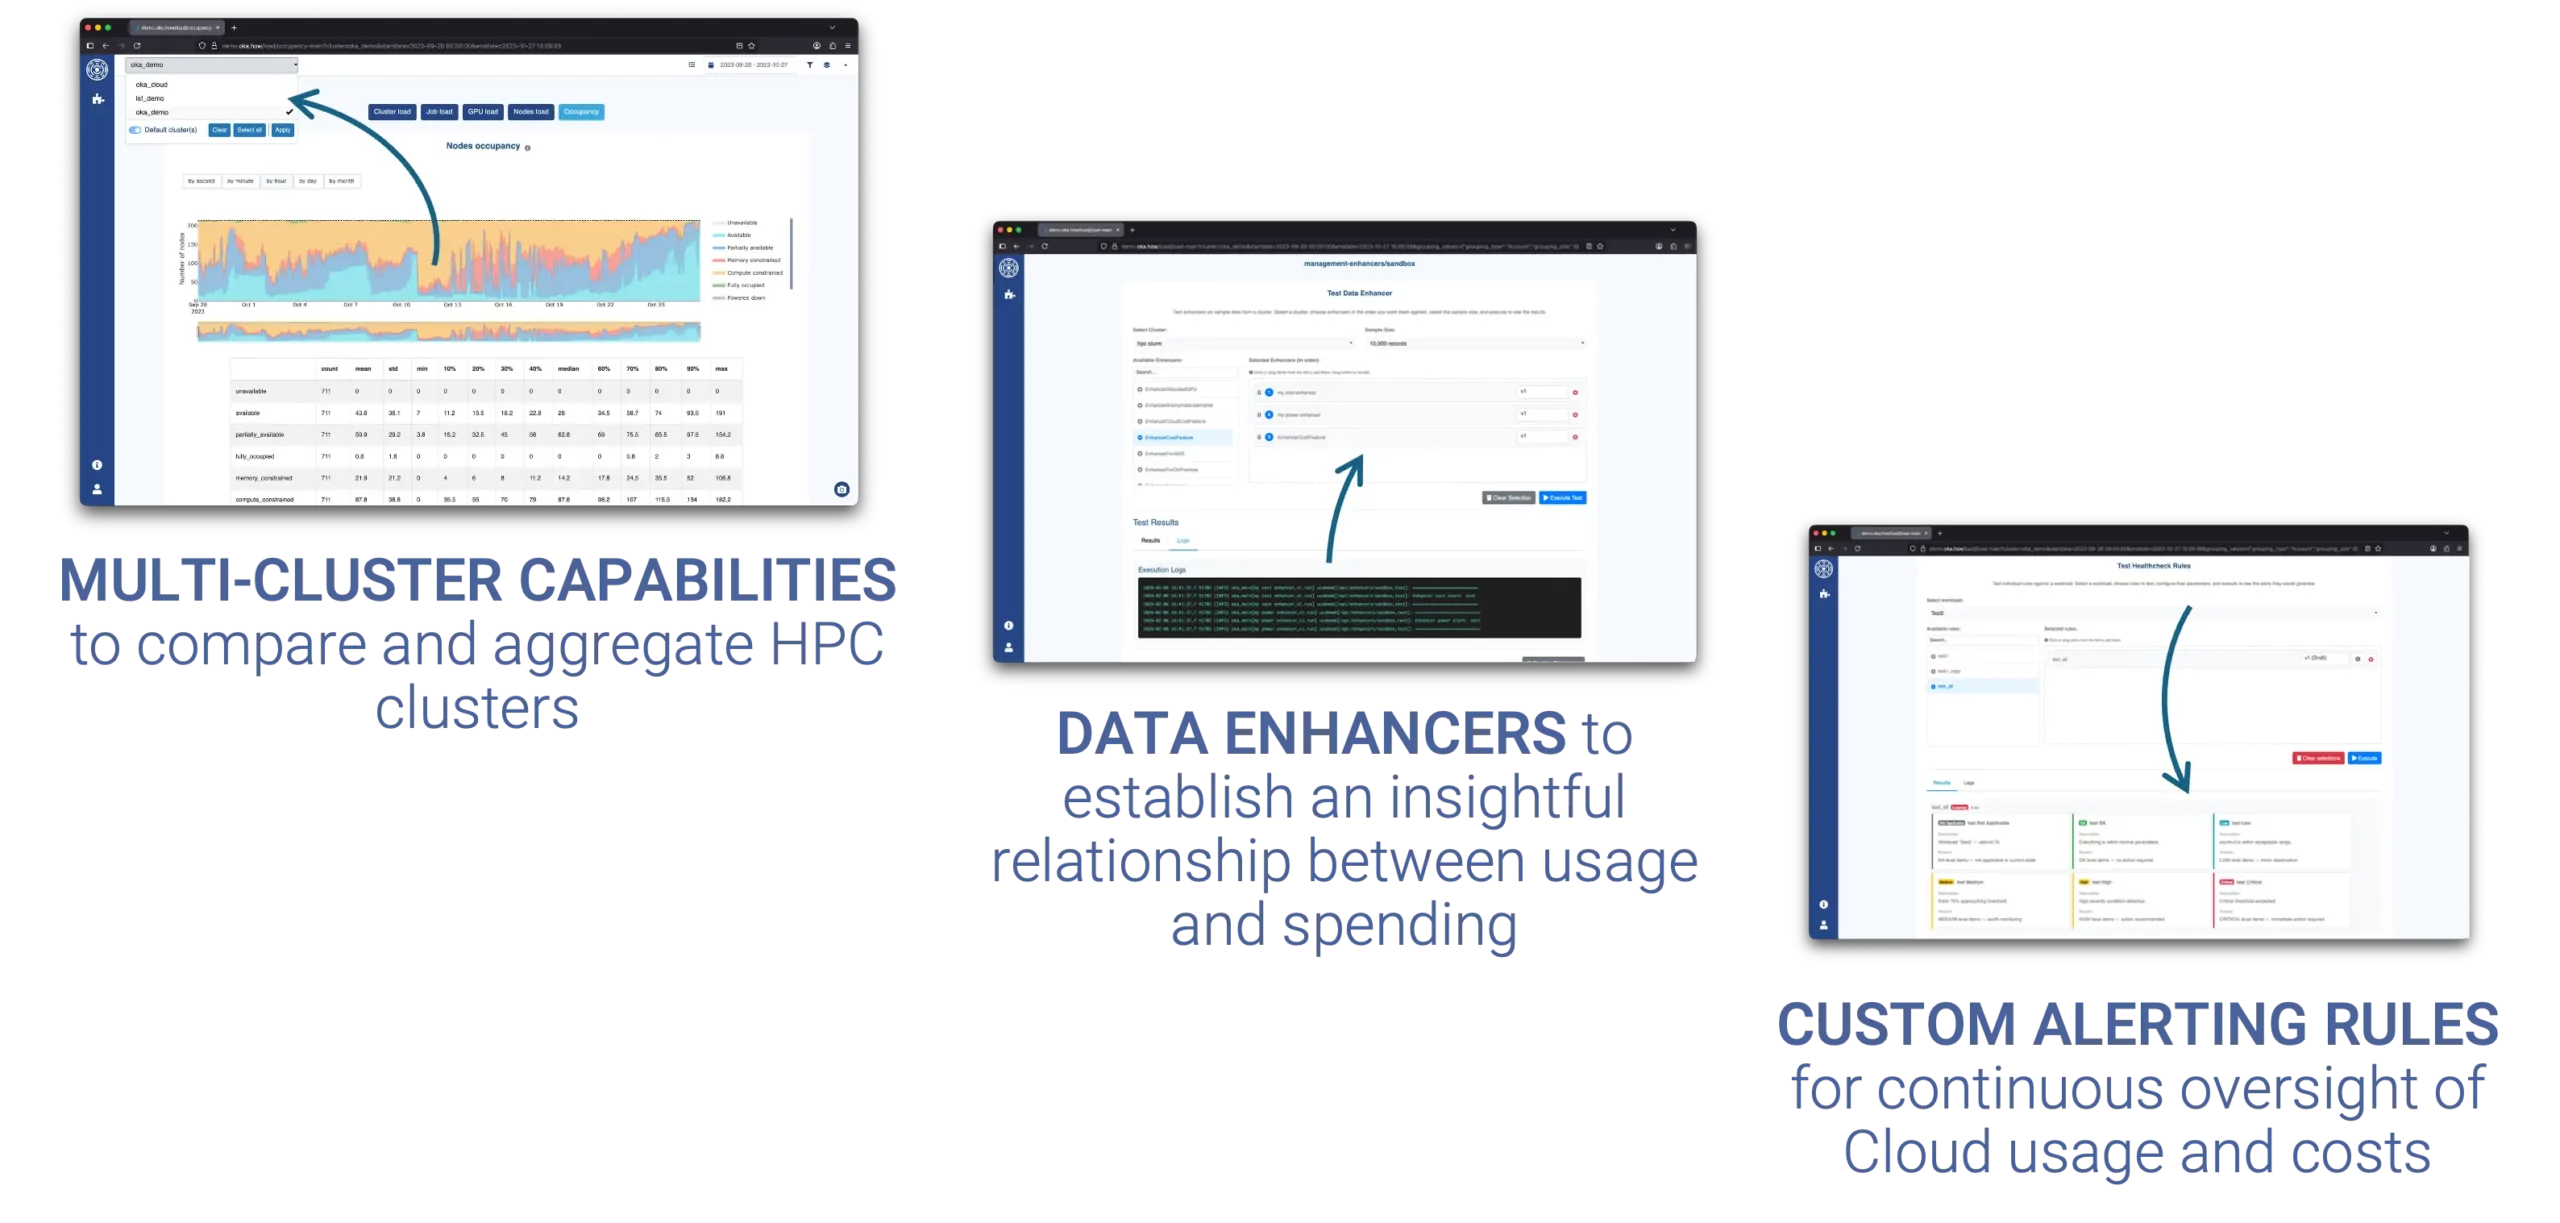
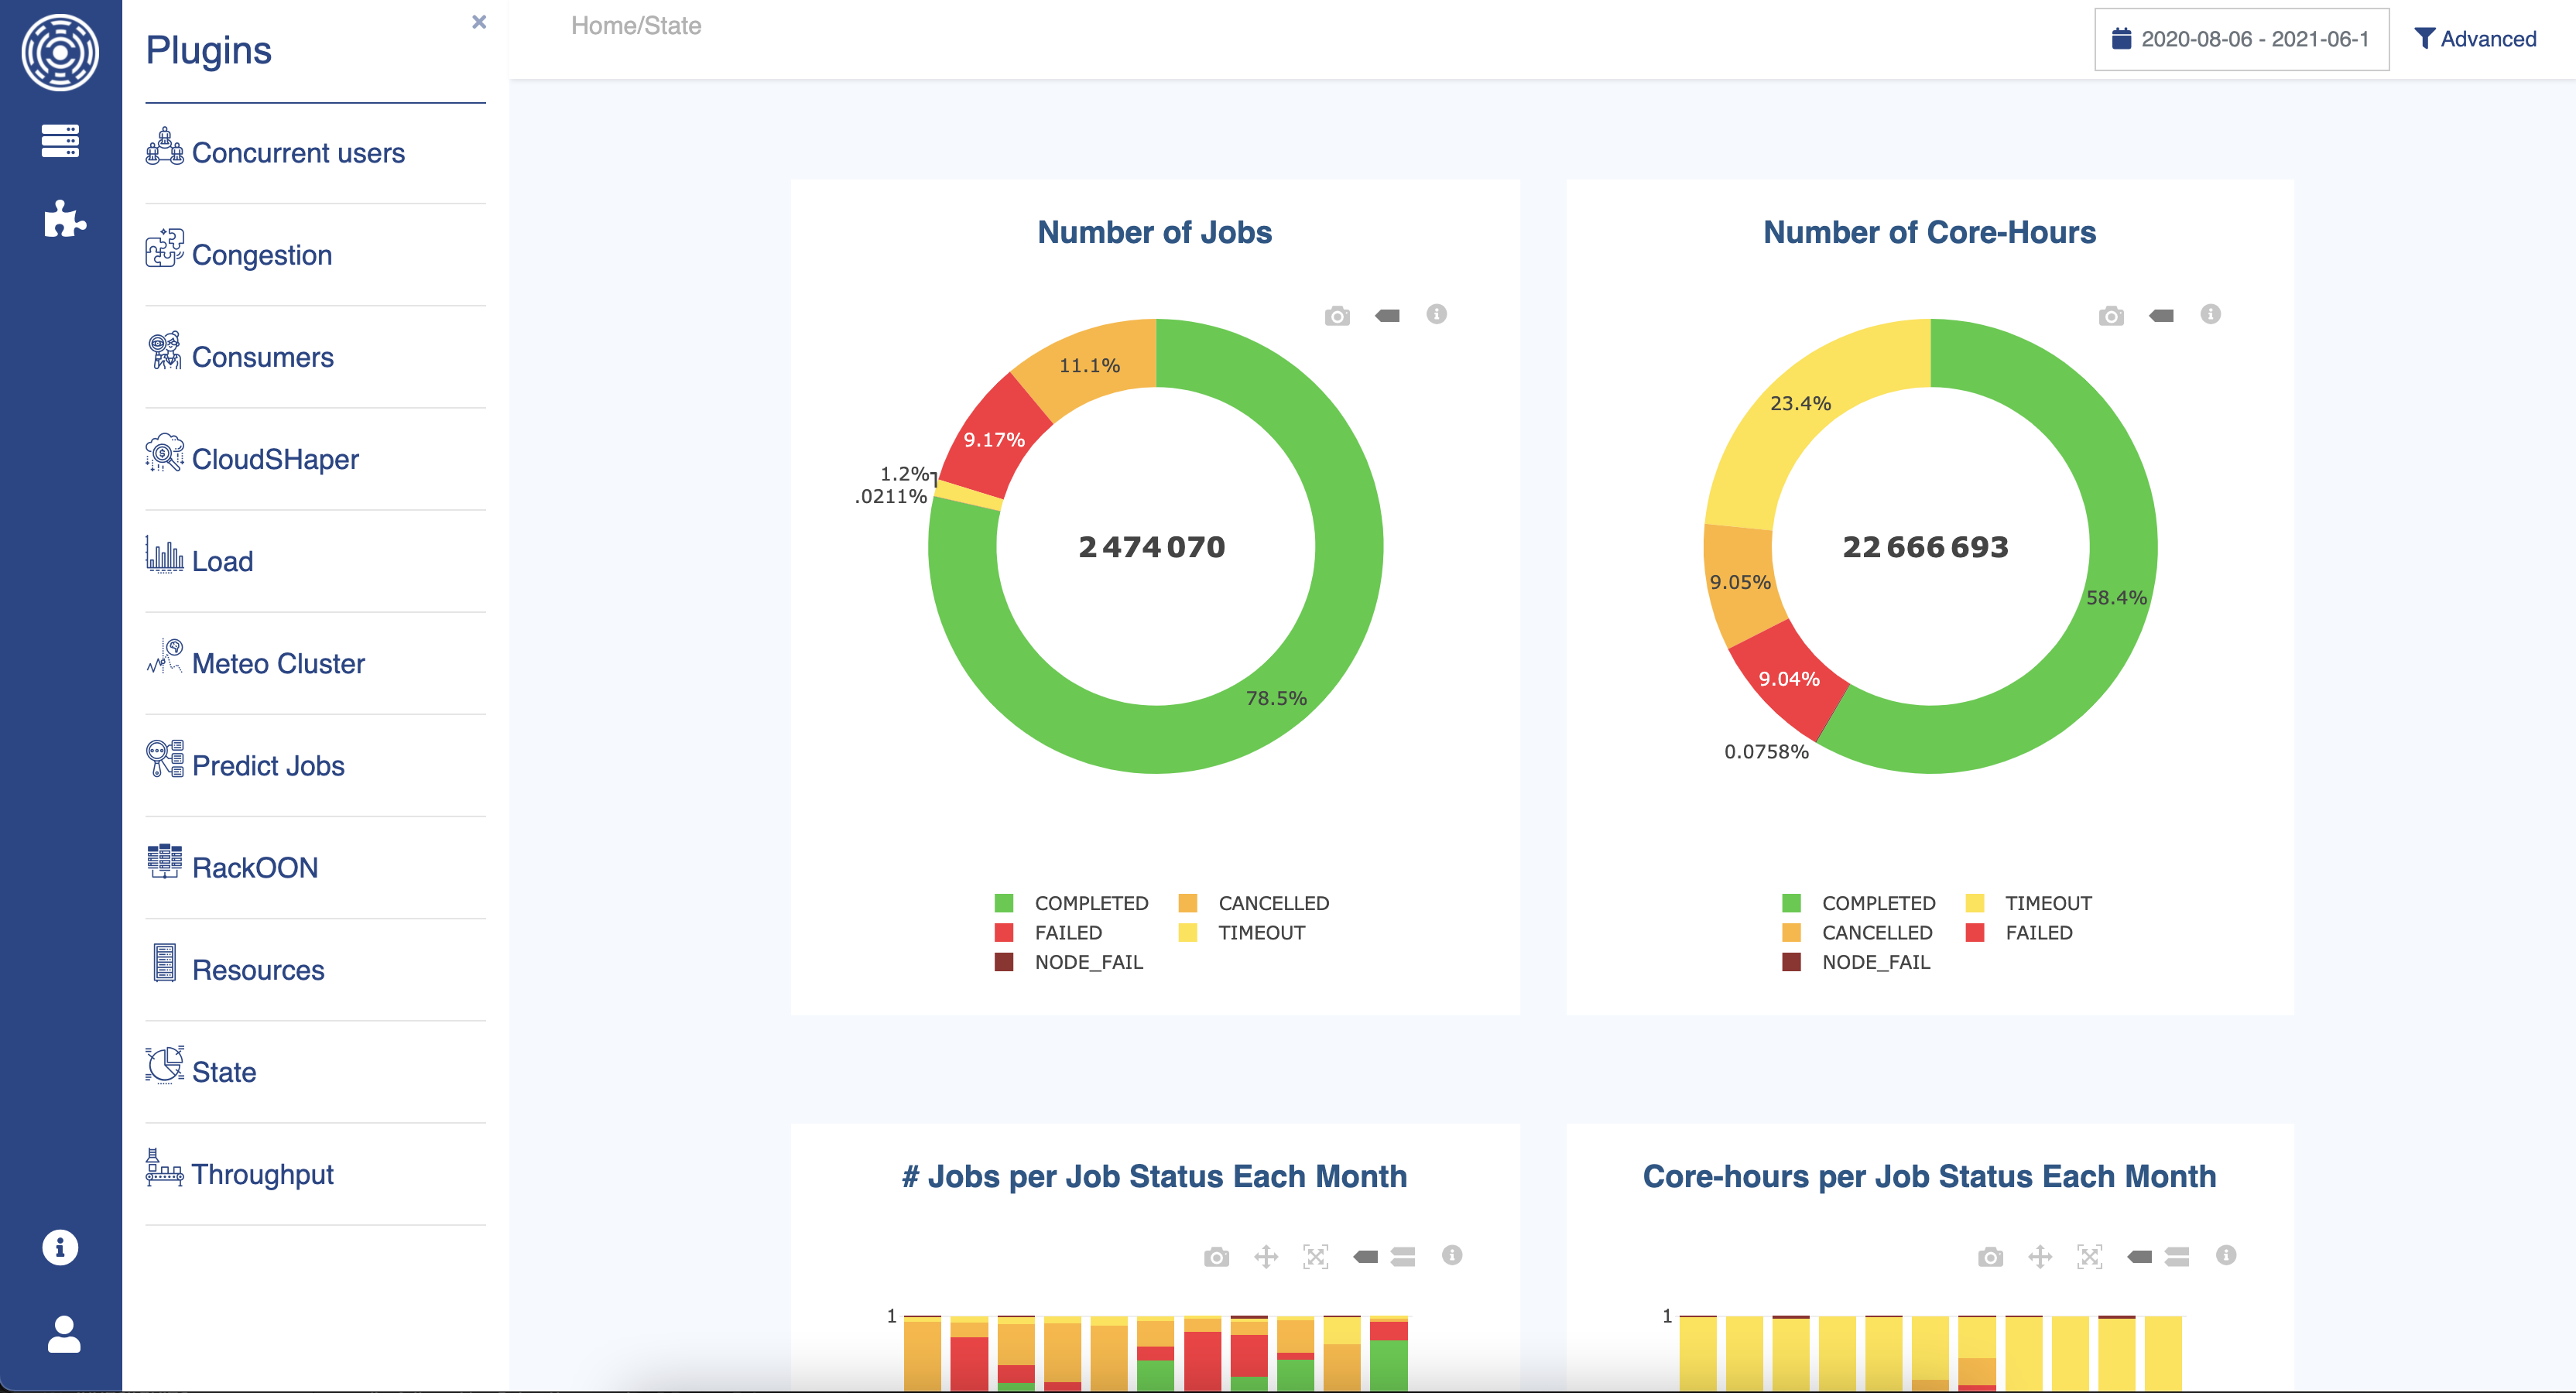
Understanding your cluster usage (cluster analytics)
OKA provides 20+ HPC-native dashboards, built by cluster operations experts, giving both IT staff and end-users instant visibility into the cluster’s behavior. No custom development needed, no pipeline to build – just connect your scheduler accounting logs and explore.
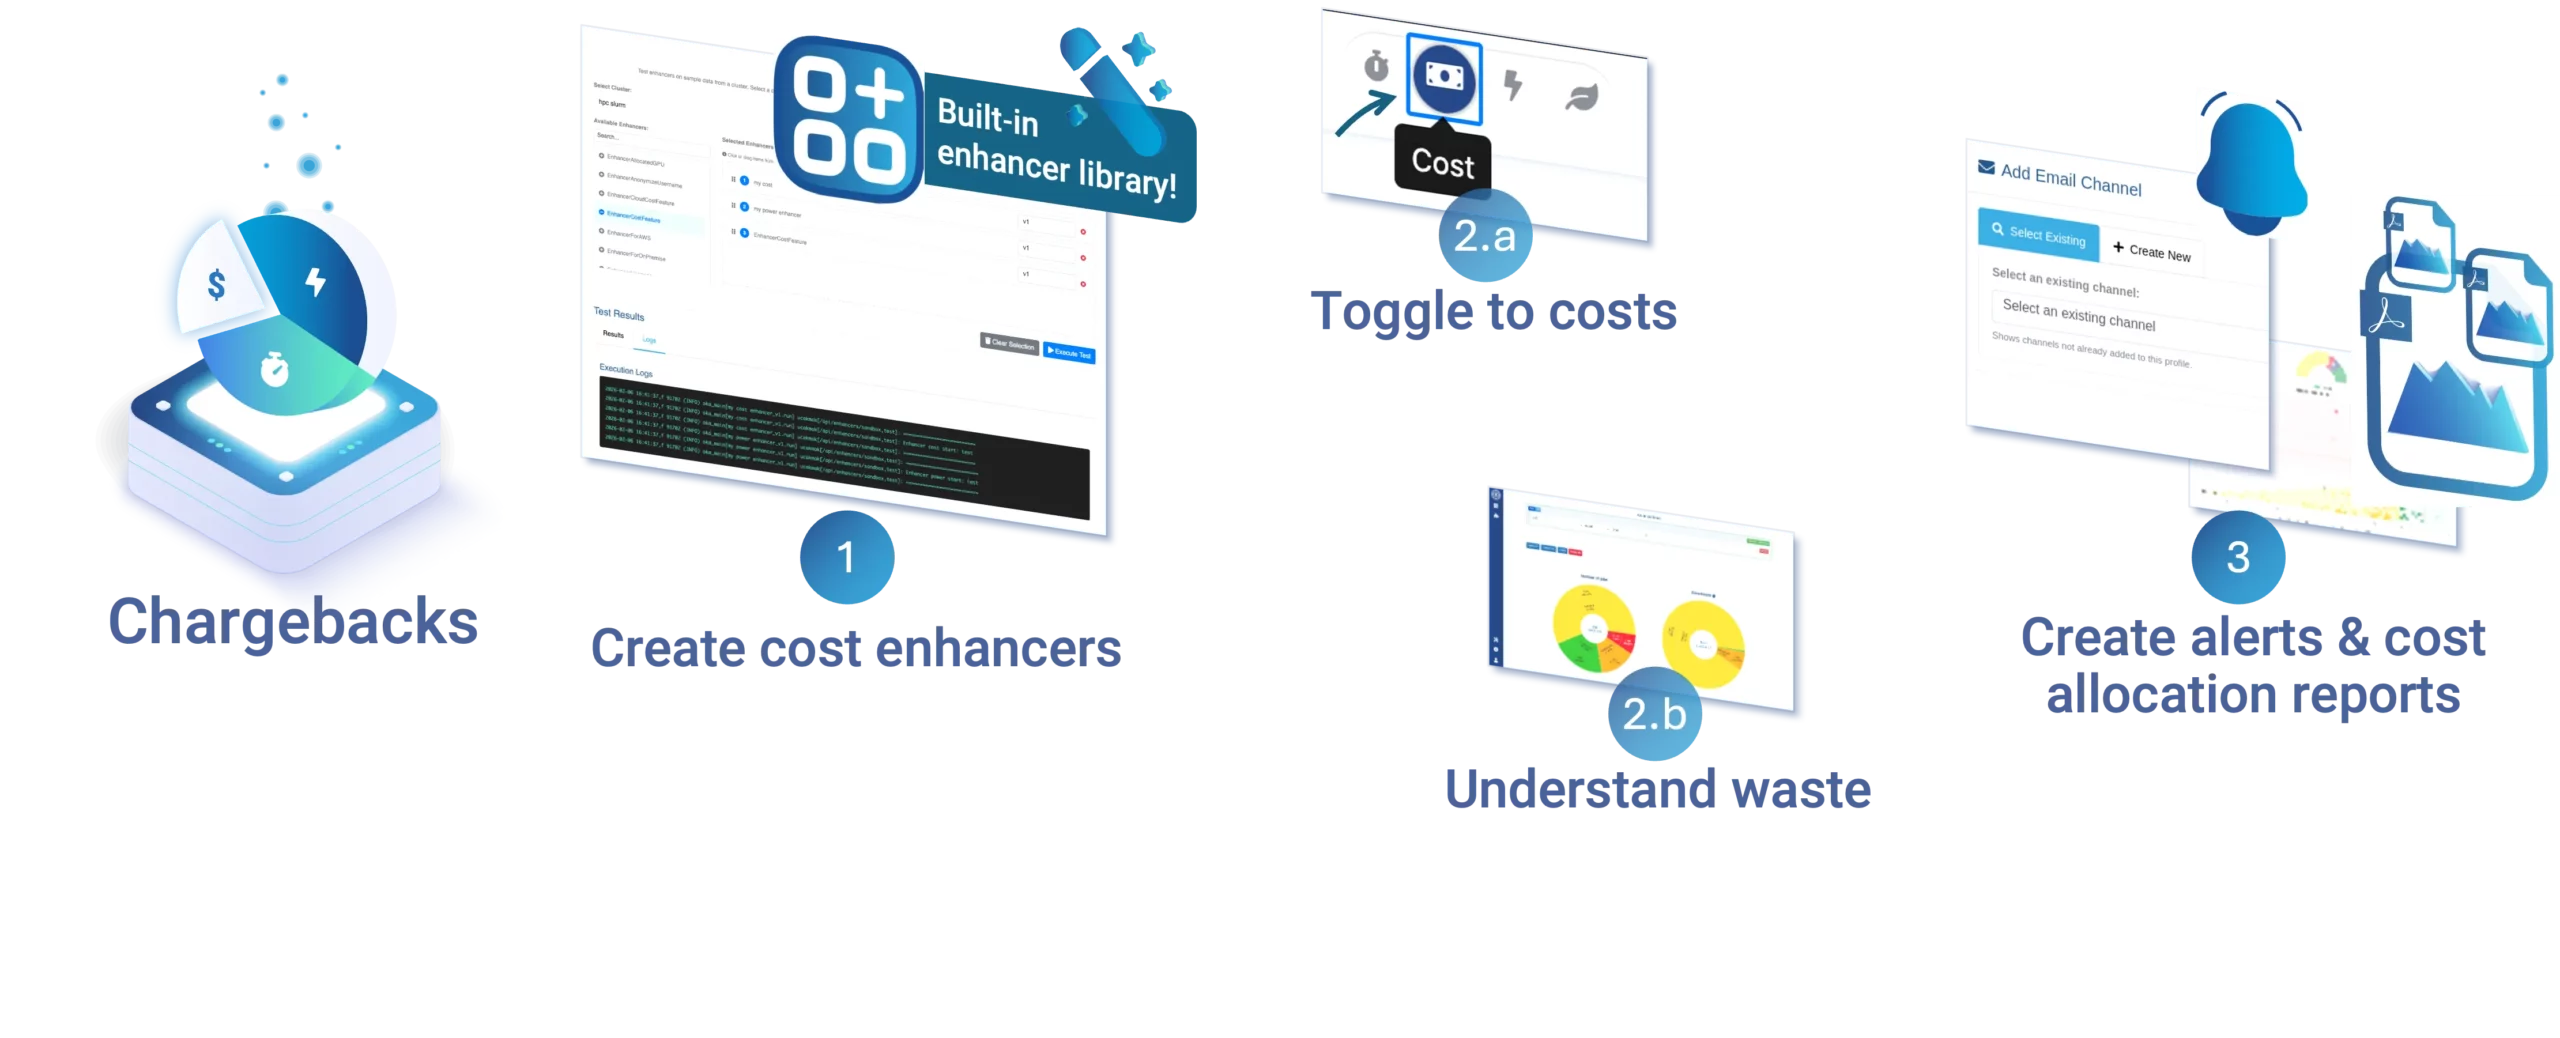
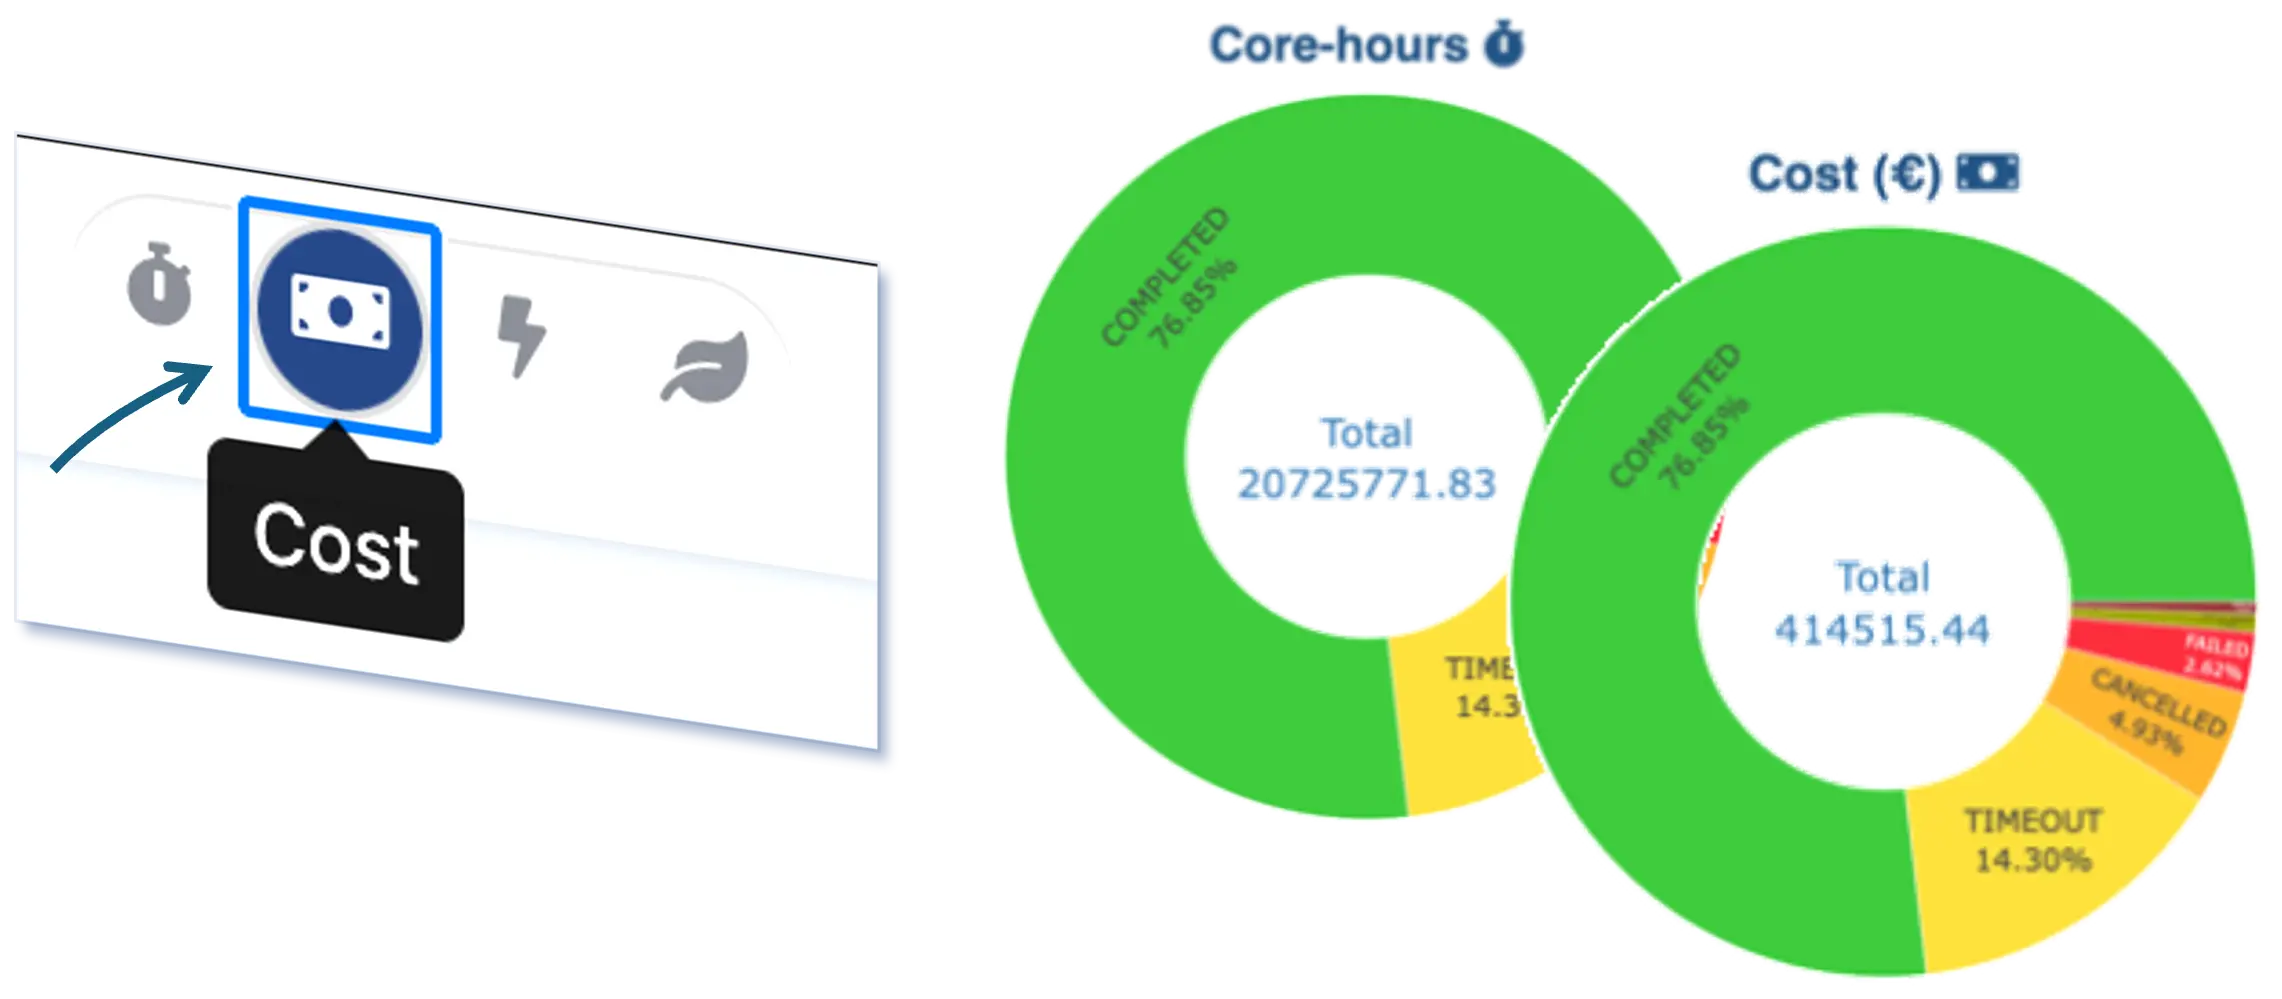
Usage & costs chargebacks
OKA’s cost allocation features let you build and apply your own cost model at workload level – from simple CPU-hour pricing to full TCO allocation across storage, data center overhead, and software licenses. The result is an auditable, automated chargeback system tailored to your financial rules.

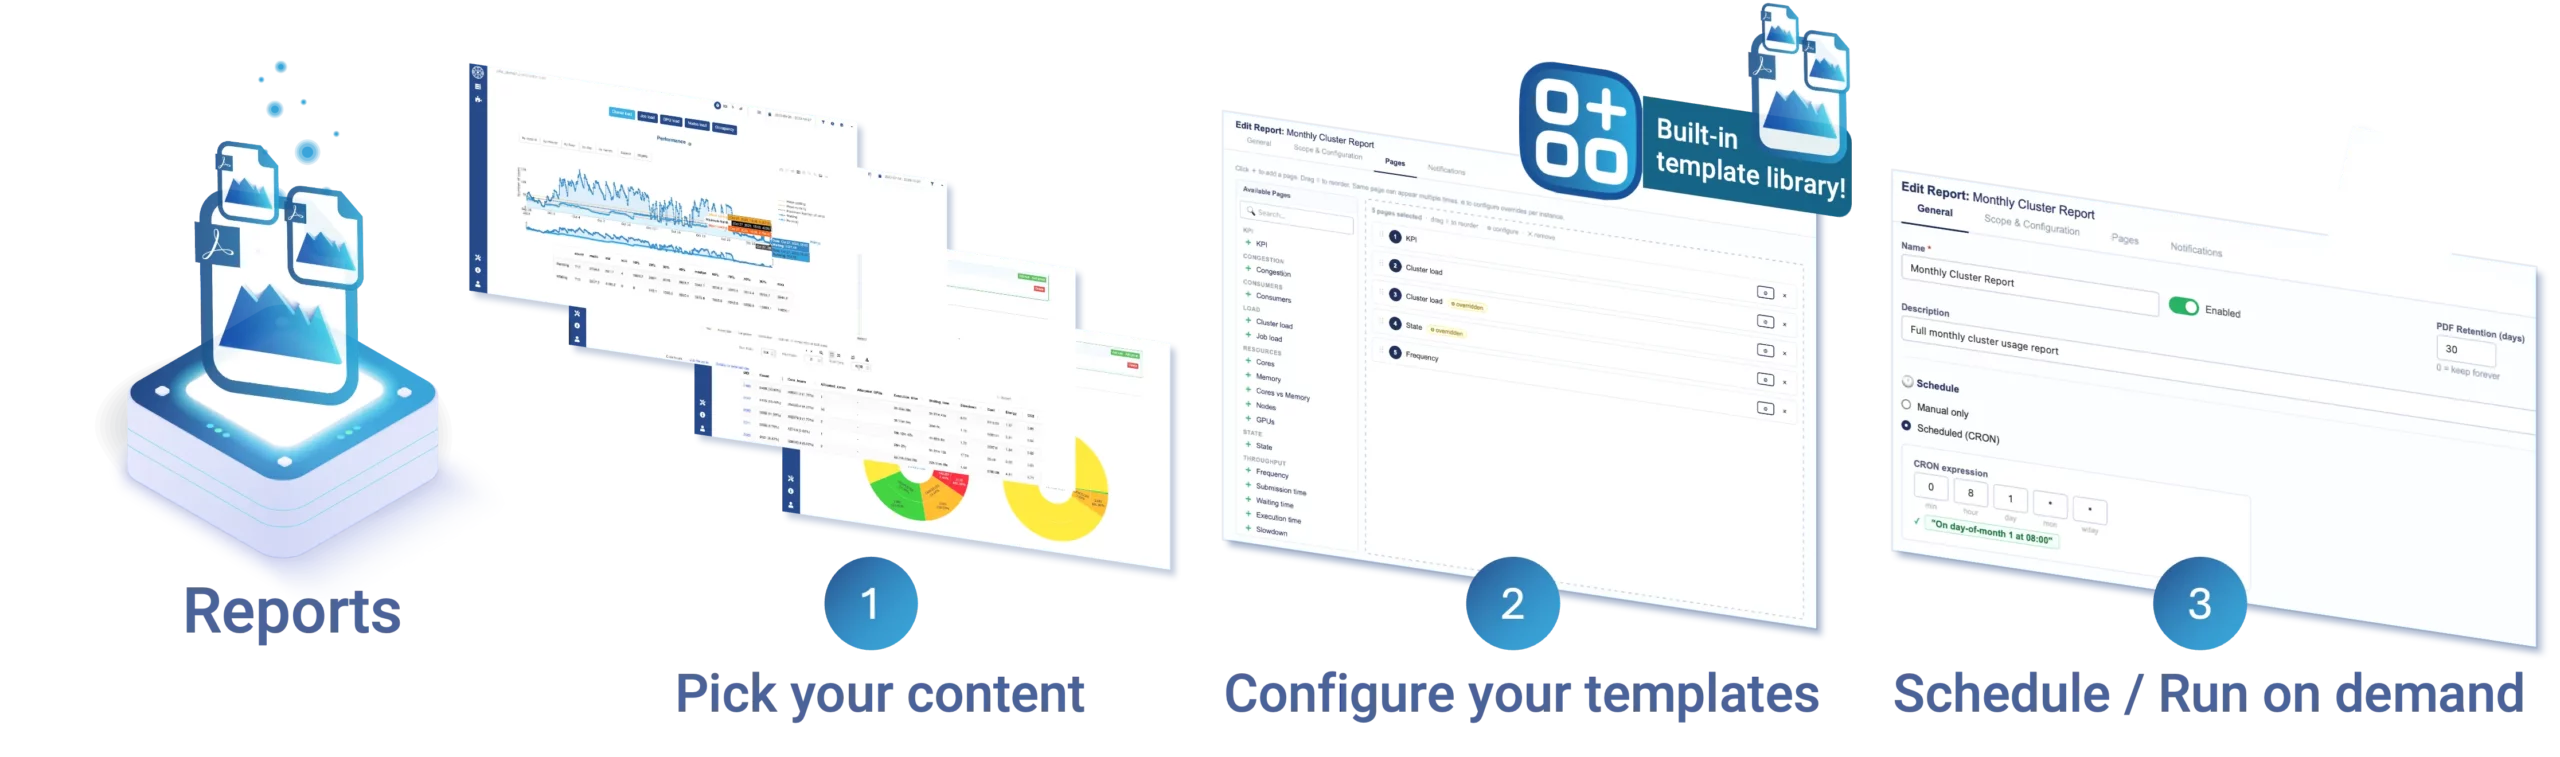
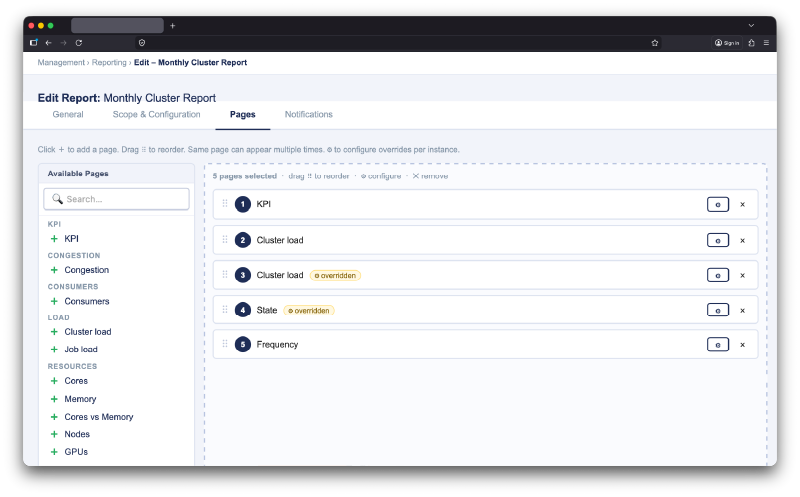
Regular utilization reporting
OKA’s Report Builder lets you define custom report templates once, then automate their generation and distribution on any schedule. Whether it’s a monthly executive summary, a per-team consumption breakdown, or a per-project job efficiency report – set it up once, and OKA handles the rest.
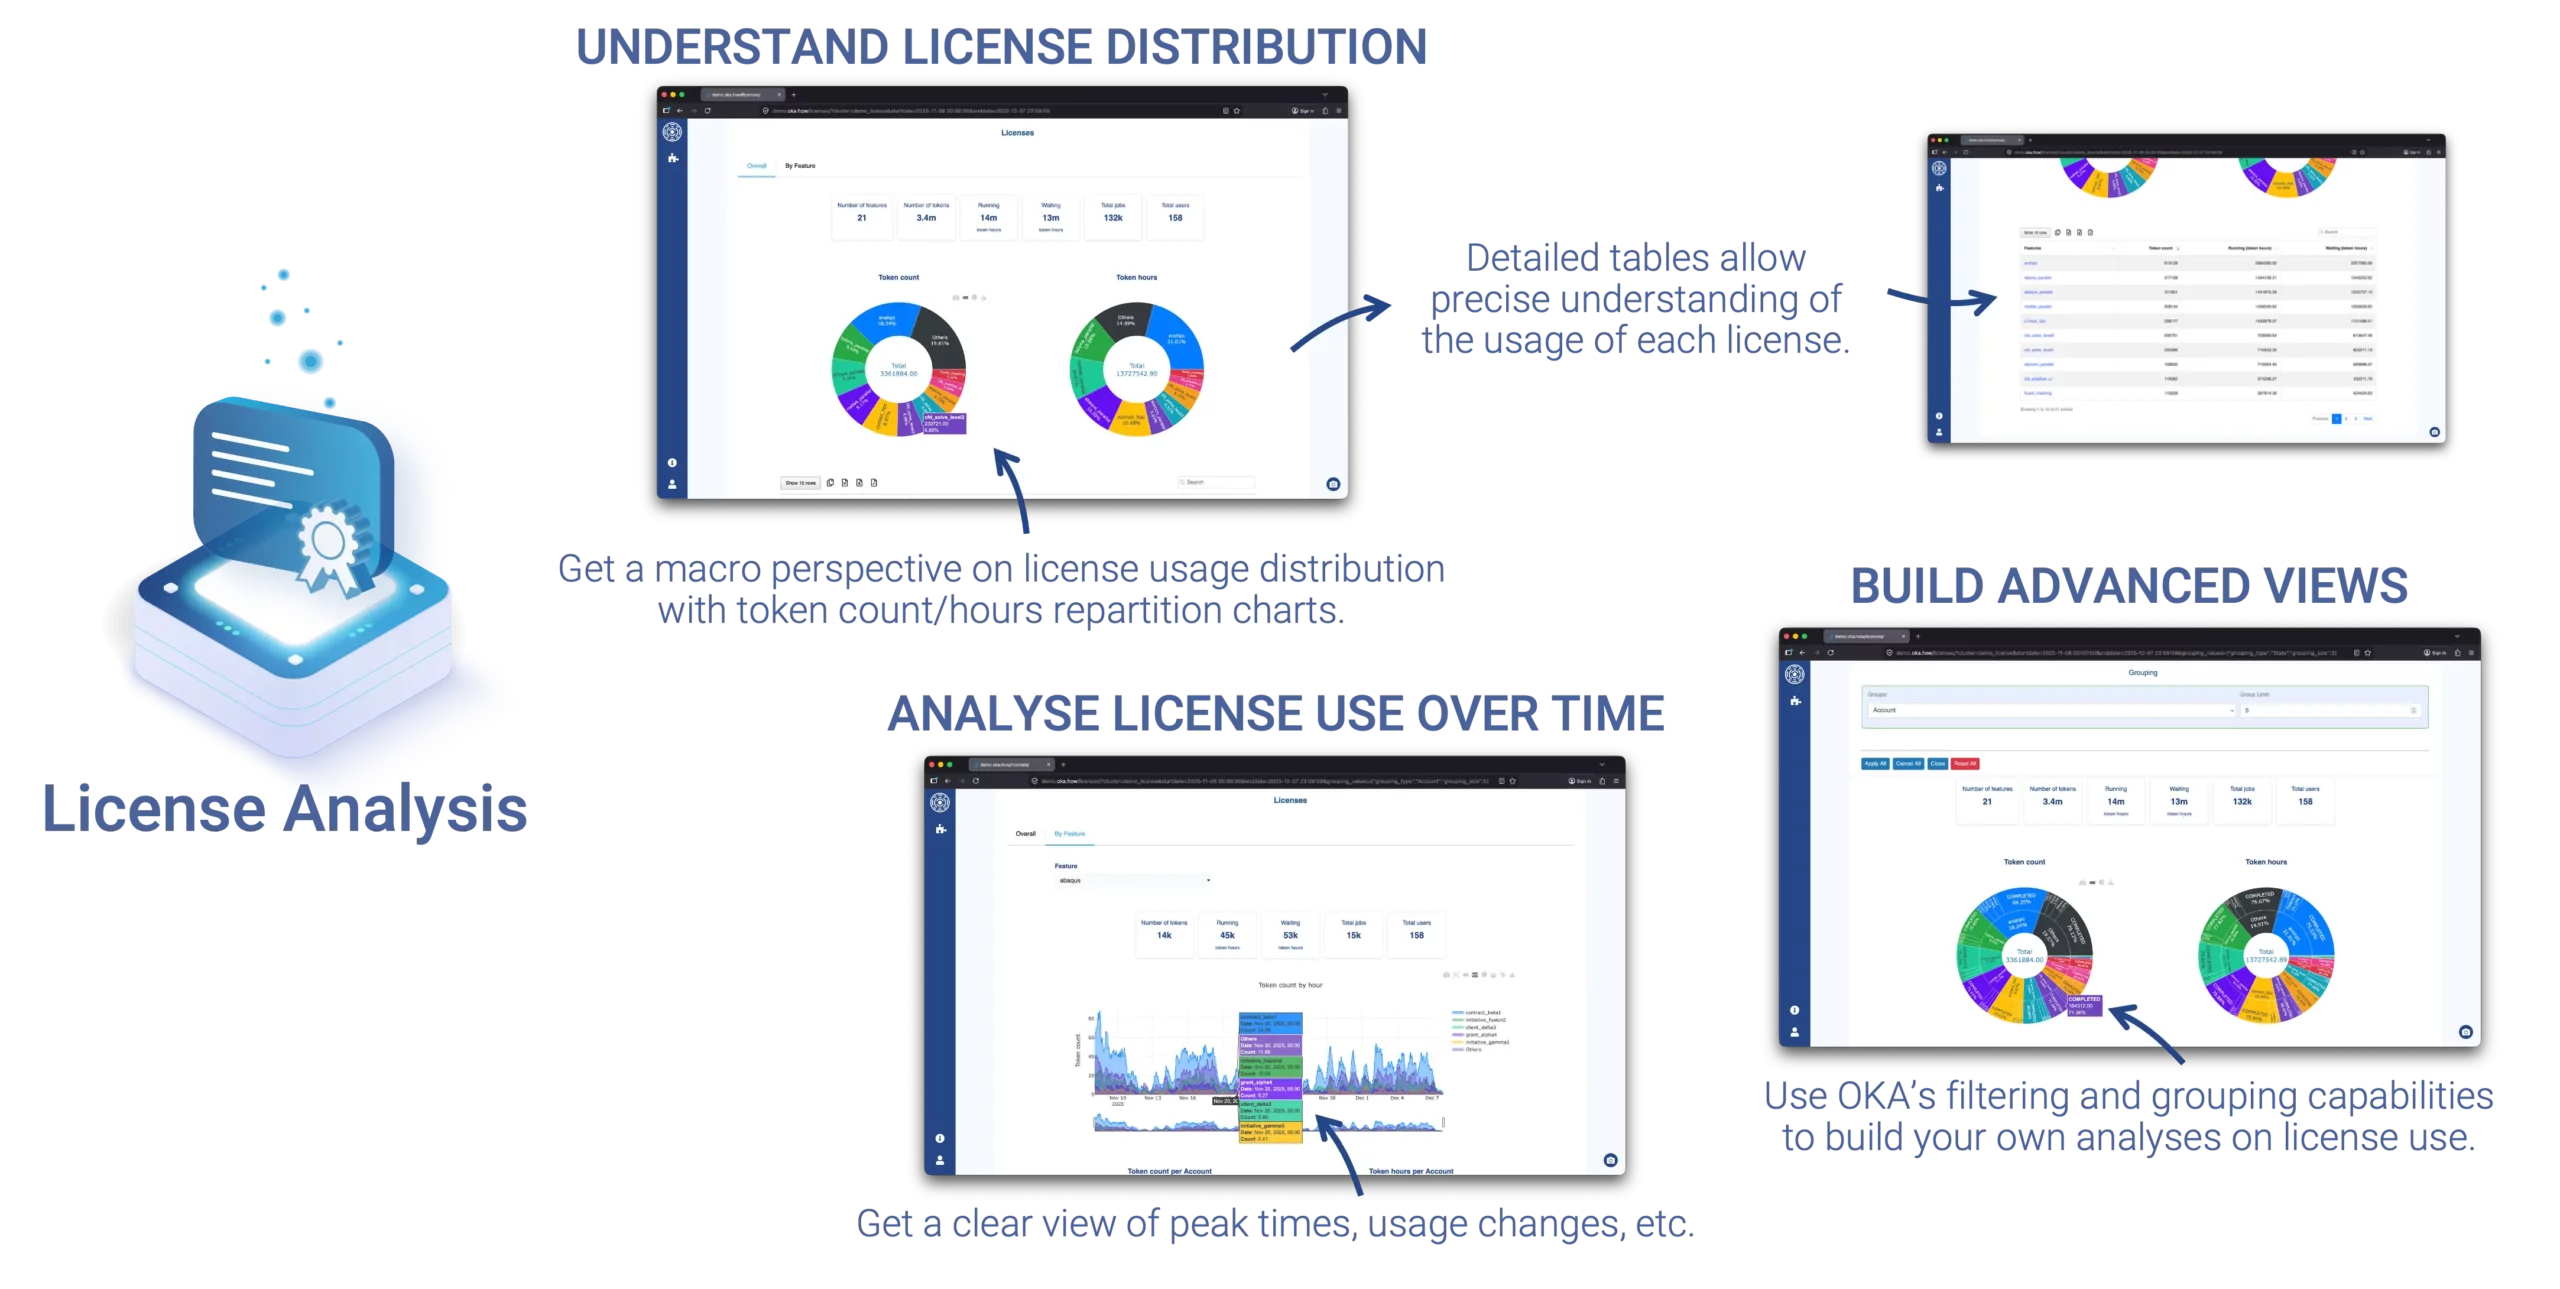
Understanding HPC license usage
In many HPC environments, software licenses represent up to 30% of total cost of ownership. Yet license usage often remains opaque, poorly attributed, and difficult to act on. OKA’s License Analysis Module brings clarity by turning scheduler-reported license data into actionable insights.
Understanding cloud computing
OKA Cloud establishes an insightful relationship between job scheduler activity and Cloud spending, giving you the tools to identify waste, right-size your resources, and optimize the cost of elasticity management – all in one platform.
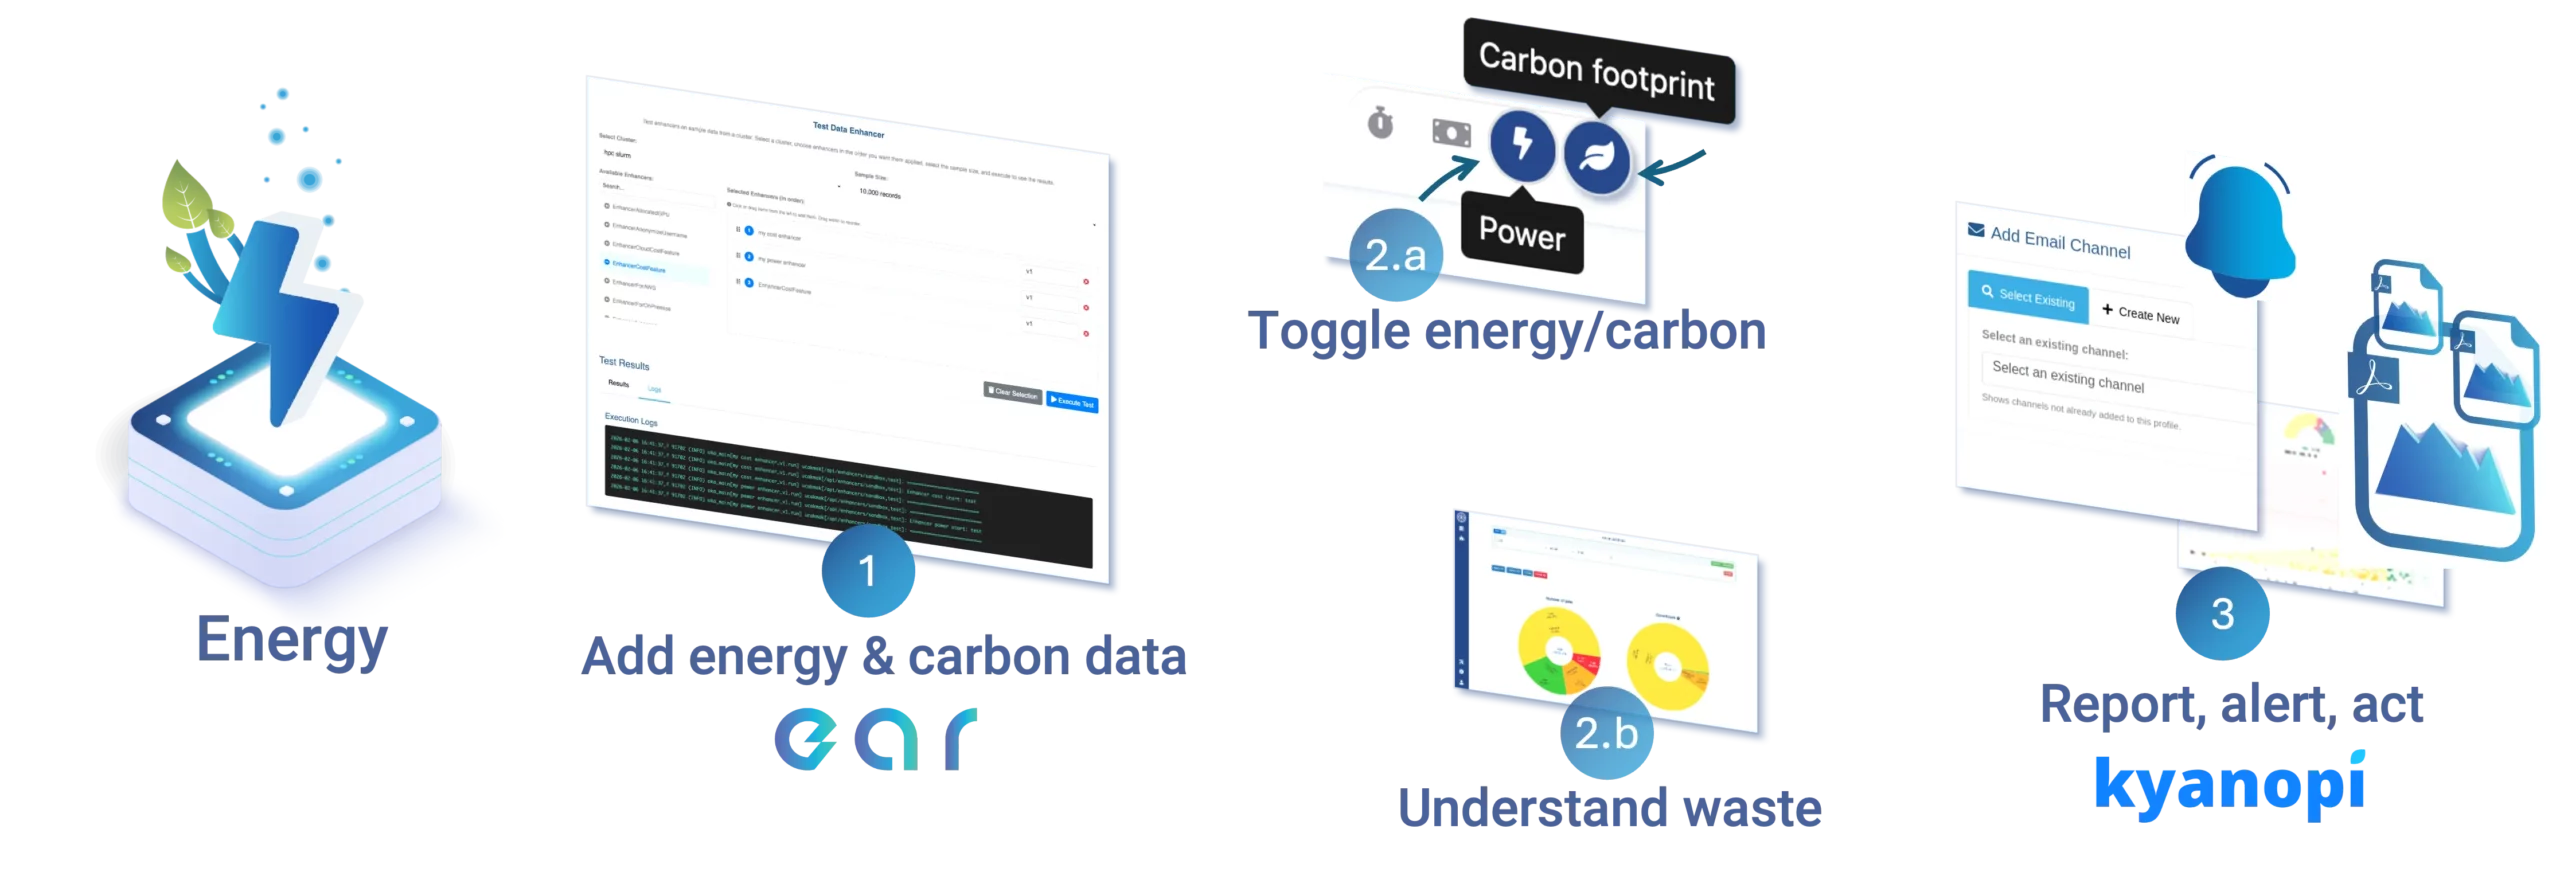
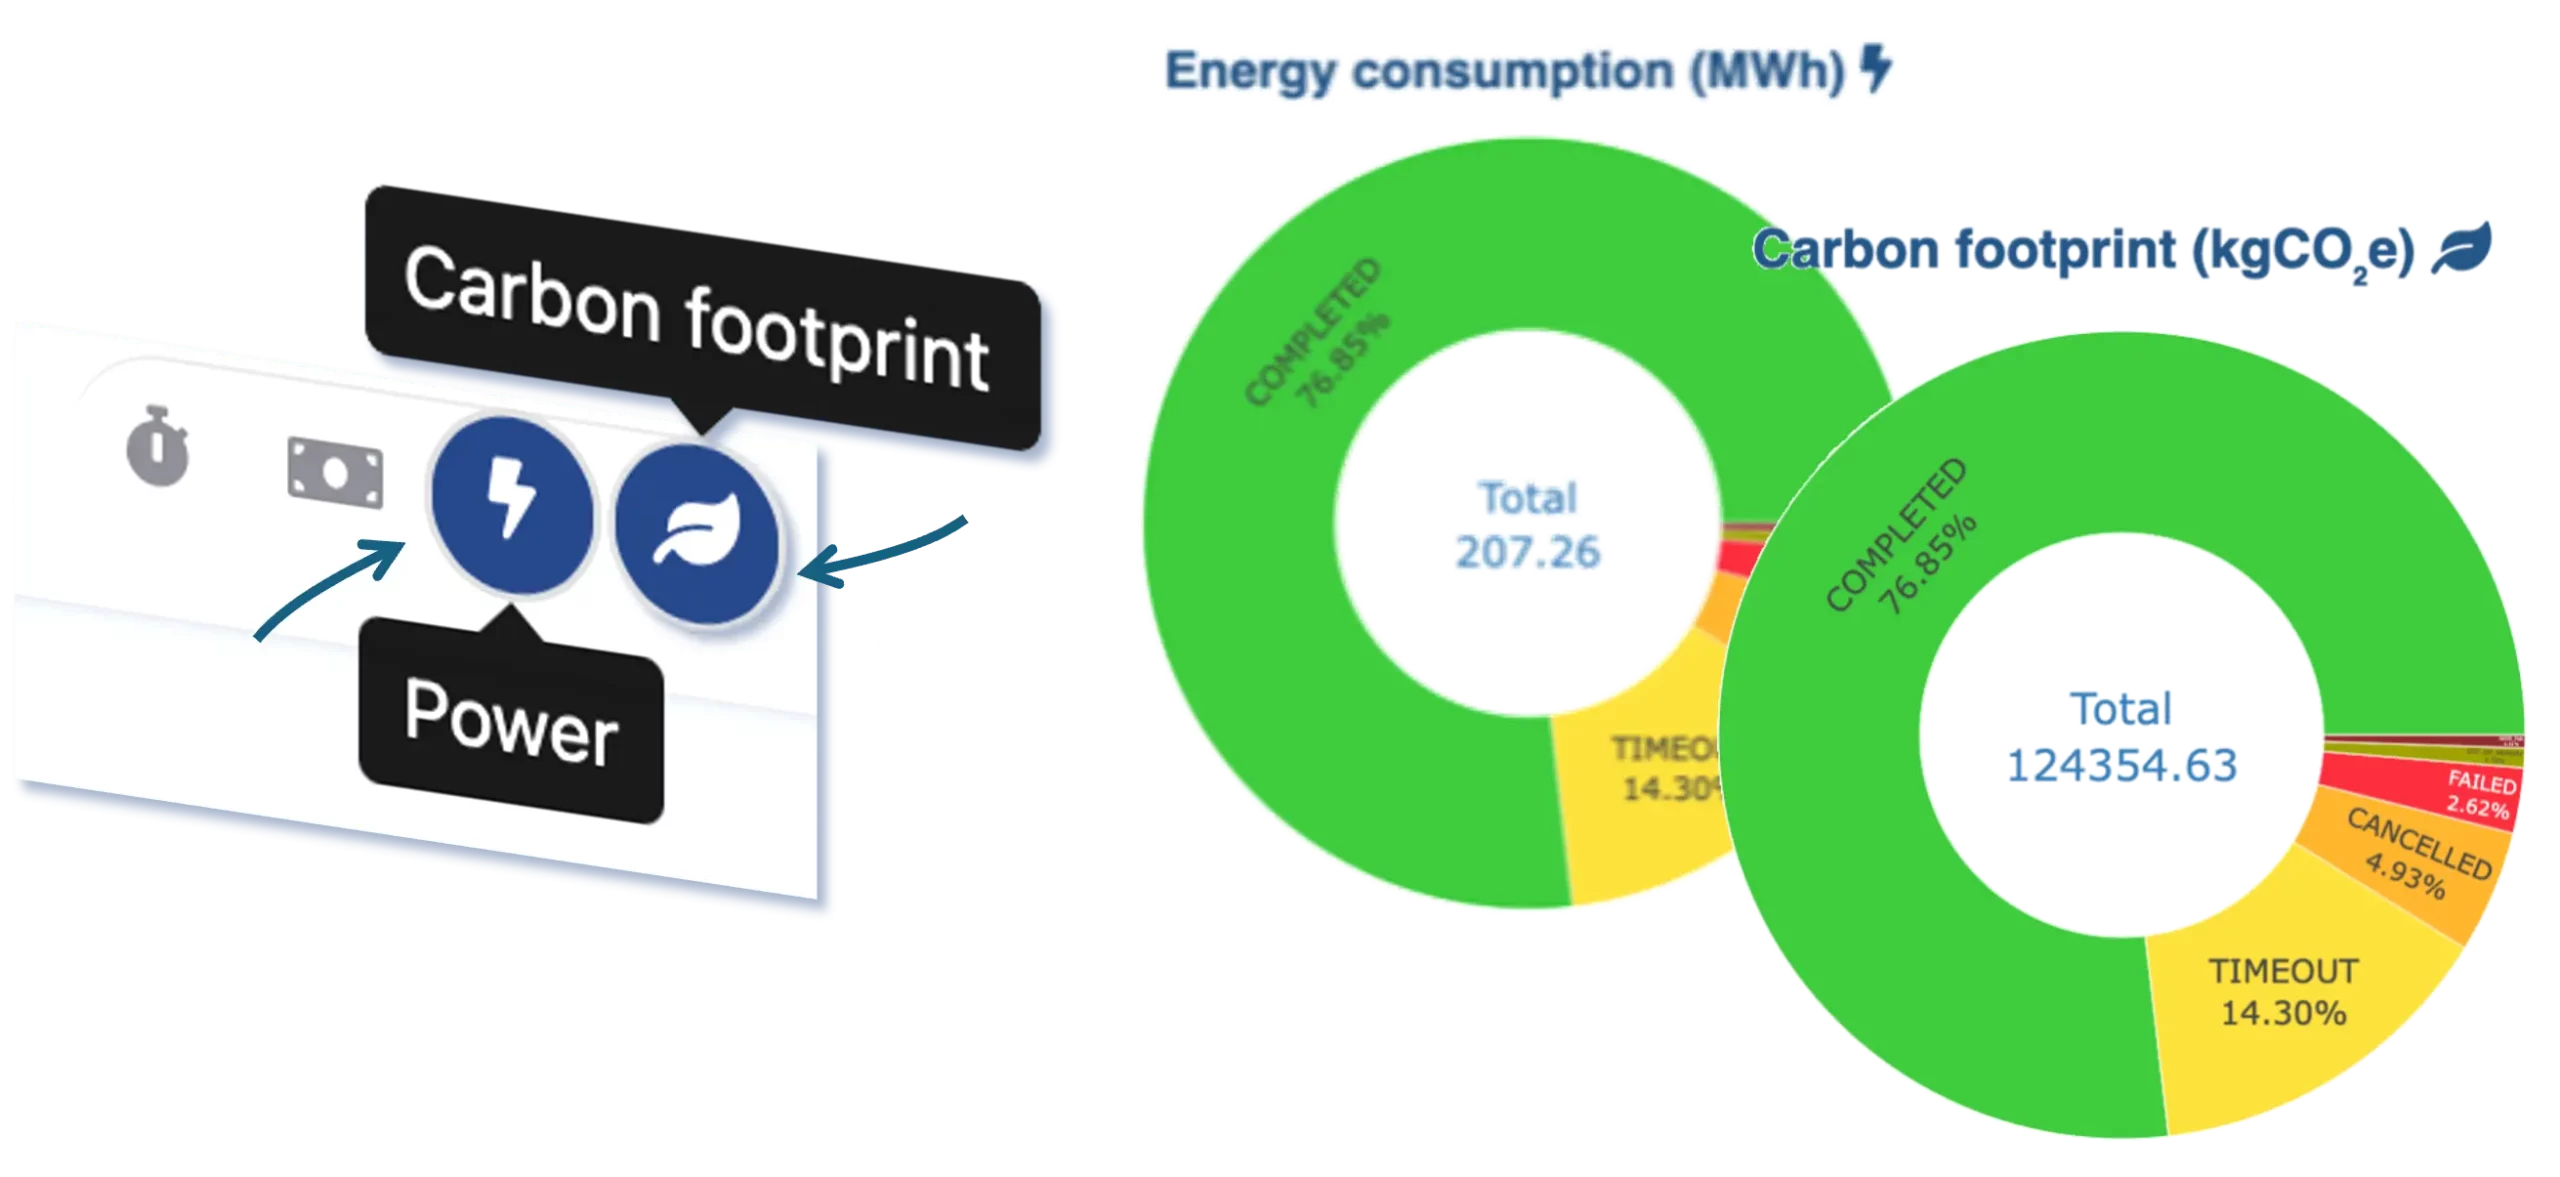
Sustainability and carbon footprint
OKA provides precise views of energy consumption and carbon footprint at any granularity – from the cluster level down to individual jobs and projects. Coupled with OKA’s Data Enhancers, this gives organizations a solid, auditable foundation for their sustainability reporting and carbon reduction trajectory.
What OKA customers say

“The integration of OKA Predict with Slurm placed a solid foundation for automation of job submission, ensuring efficient usage of the HPC cluster, which would affect in positive way not only the simulations of the end-users but also the power consumption.”
Eddy Taillefer – Okinawa Institute of Science and Technology
“OKA Core has allowed us to identify non-optimal uses of the cluster disrupting its operation.”
Matthieu Marquillie – HPC Lead at Université de Lille

“With HPC users becoming increasingly conscious about the cost and environmental impact of HPC systems, the OKA tools are increasingly being put forward to our customers to help address these challenges.”
Andrew Dean – Sales Director at OCF
They also use OKA


HPC resources rarely operate at their full potential
Resource waste
Resource utilisation rates are suboptimal
Energy
HPC is a heavy energy consumer
Costs
Inflexibility
End-user productivity
These inefficiencies affect time-to-results for end users
OKA’s battle-tested components help you tackle the most beneficial areas of your clusters’ rooms for optimization

Identify abnormal user behaviors and job submission patterns

Improve cluster overall quality of service

Limit waste of compute resources
What resources are left unused, while requested by your users?

Identify states of congestion and contention in your clusters

Plan and motivate future evolutions of your clusters
Easy-to-use interface and consistent integrated components
Per-cluster views and user management


The right component for each and every optimization area
Advanced data filtering to get all the answers you need, at any level


Forecast and detection
Plan in advance the behavior of your clusters: either globally or at the level of a job. Plan your projects on to
low-activity periods; anticipate peaks of load… become proactive and anticipate problems.
Costs
How much will it cost to run a specific workload in the cloud? Project the necessary budget based on the
desired scenario.
Then, monitor and control your actual Cloud consumption on a day-to-day basis.


Physical view
Follow the evolution of your metrics server by server and visualize where physically the “hot spots” are
located.
Help and support
Find help, FAQs, and a direct link to our support in one click.
