
From alert to action: connecting OKA to your ops toolchain with open-source webhook bridges
An alert that fires but reaches no one is indistinguishable from no alert at all. A smoke detector that only blinks a red light in the server room is useless if the operations team is on a different floor, working in a different tool, at a different hour. Detection is not the end of the story, delivery is.
OKA, developed by UCit, is an all-in-one HPC analytics platform that ships with over 20 native dashboards covering resource utilization, user behavior, job efficiency, sustainability reporting, and cost tracking: all without requiring custom development from your team. It ingests data from your job scheduler (Slurm, PBS, LSF, …) and immediately surfaces actionable insights through its built-in modules: statistical analysis, anomaly detection, forecasting, and automated reporting.
In this series, we have been building up the layers of observability that turn raw scheduler data into operational intelligence. In a first article, we showed how Data Enhancers enrich that raw data with custom columns: energy readings from EAR, carbon footprint from the electricity grid, and cost figures from your internal pricing model… In a second article, we covered Healthcheck Rules: Python scripts that run on a schedule inside OKA, monitor enriched metrics for anomalies, and fire structured alerts when a threshold is exceeded.
This article covers the third and final layer: Webhook Bridges. When a Healthcheck fires (a GPU partition sitting idle above its threshold, a user’s job running past its expected wall time, a burst of failed jobs…) OKA can call any HTTP endpoint you configure in its notification profile. A webhook bridge is a small, self-contained Python microservice that sits at that endpoint, translates the OKA notification into the native format of a target tool, and forwards it. Slack, email, Jira, or a full PDF report: the bridge decides what happens next.
This article walks through four open-source examples from the oka_webhooks repository (coming soon!). Each addresses a concrete integration need. Whether you adopt one as-is or use it as a starting point, these examples cover some of the most common destinations we encounter at HPC operations teams.
COMING SOON! The source code for all bridges discussed here is available in the
oka_webhooksrepository.
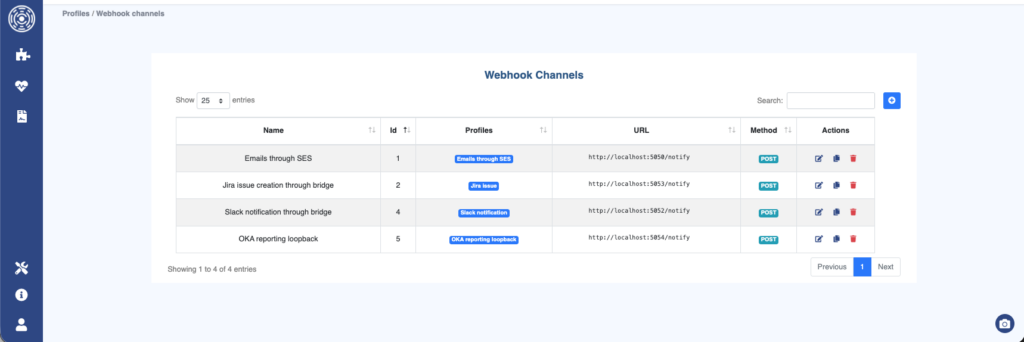
How OKA triggers a webhook
Before looking at the individual bridges, it helps to understand the mechanism that activates them.
OKA’s Notification Profiles (configured in the admin panel under Management → Notifications) connect a set of healthchecks to one or more delivery channels. A single profile can combine several channel types simultaneously: email (delivered directly by OKA via SMTP), file (appended to a log file on the server), and webhook (an HTTP POST to any URL you configure). When a healthcheck breaches its threshold, OKA evaluates the profile and fires every channel in it, so you can send an internal email and trigger a Slack bridge at the same time with a single profile. For webhook channels, the payload is always the same minimal JSON structure:
{
  "subject": "[OKA Healthcheck] High GPU idle rate on partition gpu: High",
  "body": "Partition: gpu\nIdle GPU nodes: 12/32 (37.5%)\nThreshold: 20%\n..."
}
The subject follows the pattern [OKA Healthcheck] <name>: <Level>, where <Level> is one of Critical, High, Medium, Low, or Ok. The body contains the full alert detail (which nodes, which metrics, which thresholds) formatted as plain text. This is all the bridges need to work with.
Every bridge in this repository exposes two endpoints: POST /notify for the standard JSON payload, and GET /notify accepting the same fields as query parameters: useful for testing from a browser or curl without constructing a JSON body. All bridges also expose a GET /health liveness endpoint used by systemd and monitoring tools to confirm the service is running.
The security model is simple: an optional shared secret (BRIDGE_BEARER_TOKEN) is compared against the Authorization: Bearer <token> header that OKA sends with each notification. If the variable is not set, the endpoint accepts all incoming requests: appropriate for internal networks; recommended for deployments reachable from the internet.
In production, each bridge runs as a systemd service backed by two gunicorn workers, with automatic restart on failure. A .env file holds the configuration; the included .env.example documents every variable. No database, no persistent state (with one exception, discussed below), nothing beyond Flask and the target system’s SDK or API client.
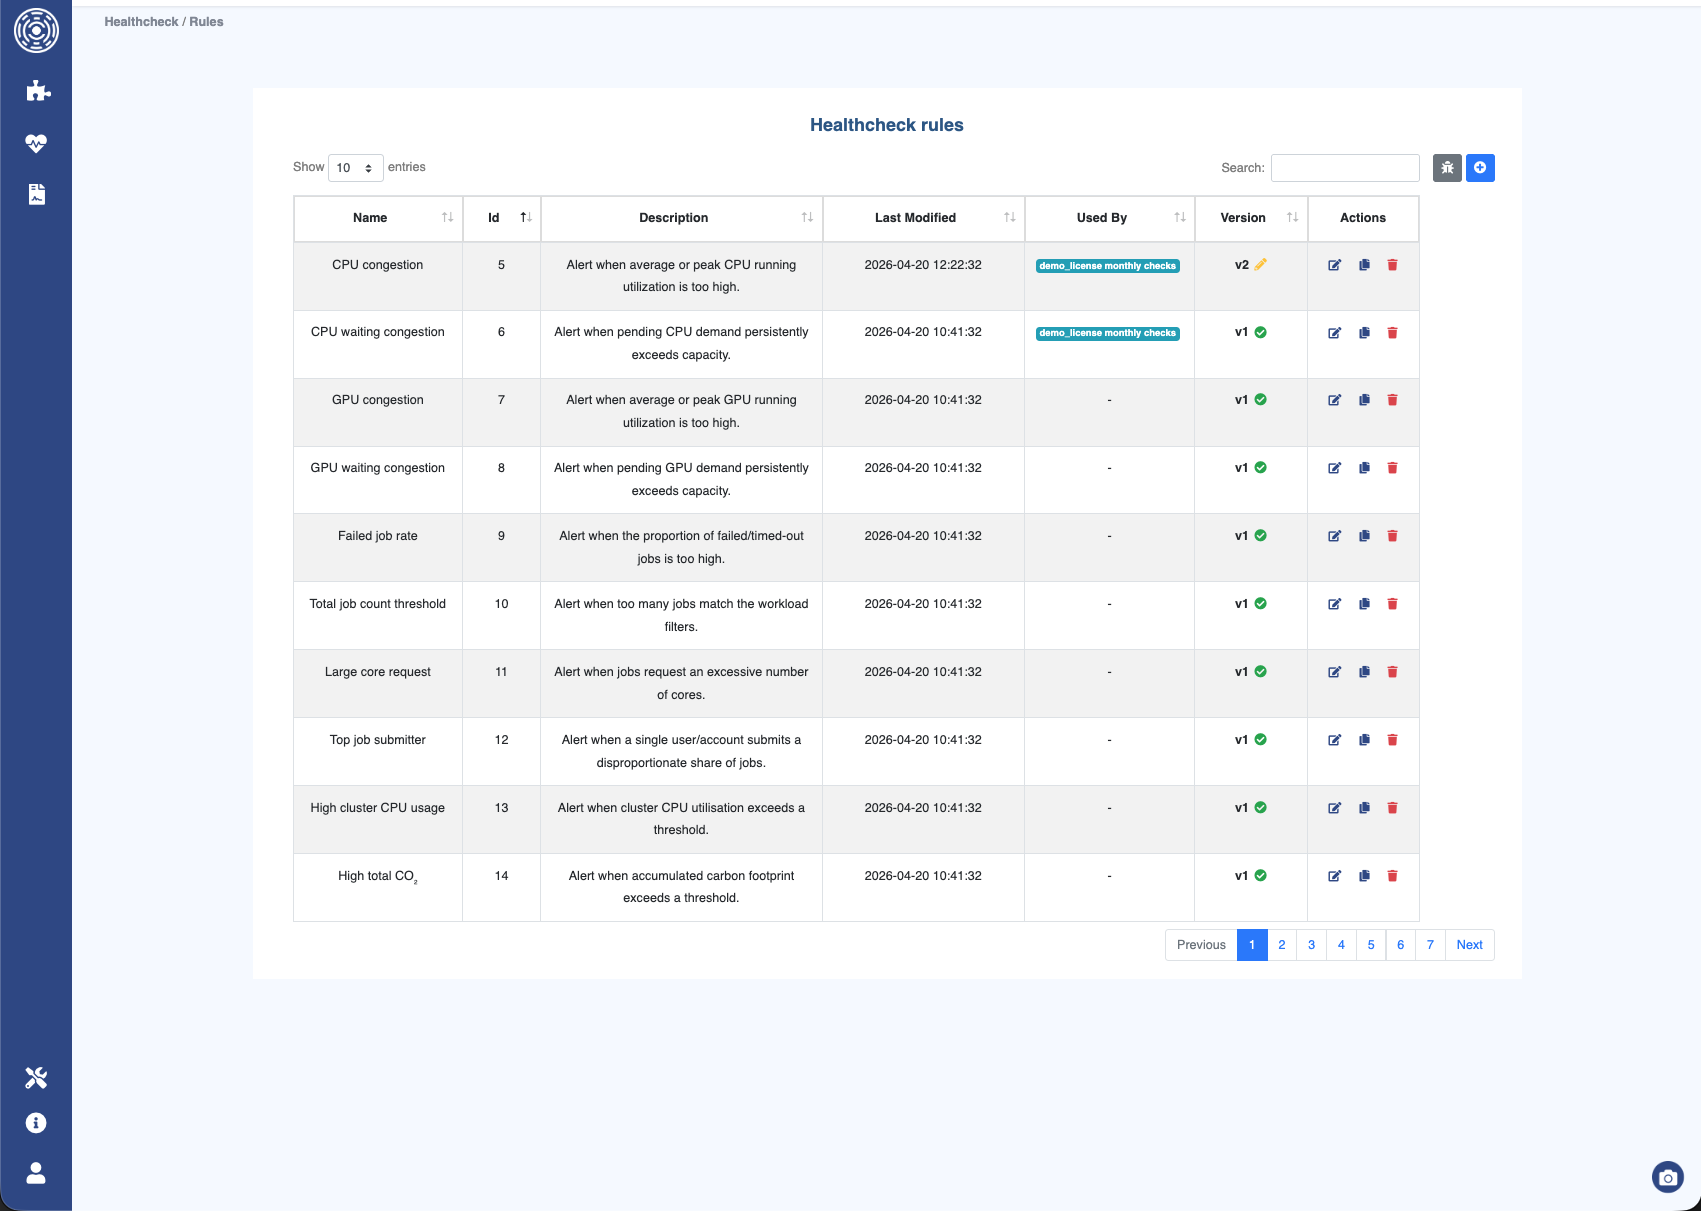
The bridges: a use-case tour
Instant visibility: the Slack bridge
The simplest bridge in the collection has exactly one required configuration variable: SLACK_WEBHOOK_URL. That is the URL from Slack’s Incoming Webhooks feature: no bot token, no OAuth scope management, no Slack app installation beyond creating the webhook in the Slack UI.
When OKA fires, the bridge extracts the alert level from the subject line using a regex and maps it to a status emoji:
STATUS_EMOJI: dict[str, str] = {
    "critical": ":red_circle:",
    "high":     ":red_circle:",
    "error":    ":red_circle:",
    "warning":  ":large_yellow_circle:",
    "medium":   ":large_yellow_circle:",
    "ok":       ":large_green_circle:",
    "resolved": ":large_green_circle:",
    "info":     ":large_blue_circle:",
}
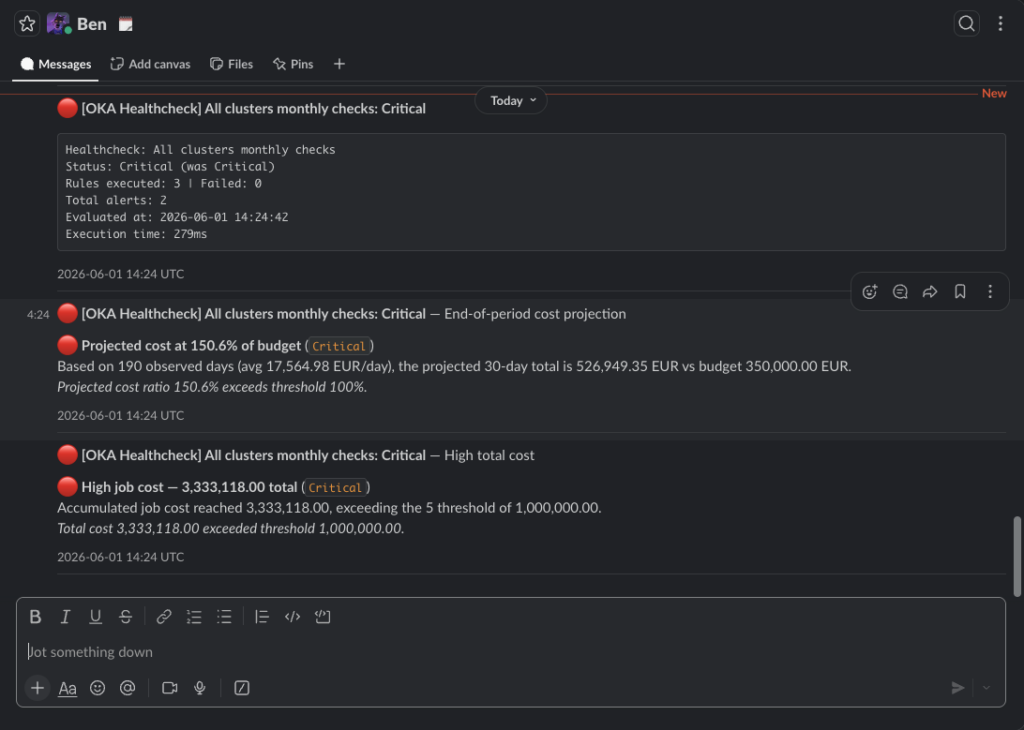
The resulting Slack message is built as a Block Kit payload: a section header with the emoji prefix and the bold subject, followed by the alert body in a code block (preserving the line-by-line formatting), a UTC timestamp in the footer, and a divider.
blocks = [
    {"type": "section", "text": {"type": "mrkdwn", "text": f"{emoji} *{subject}*"}},
    {"type": "section", "text": {"type": "mrkdwn", "text": f"```{body}```"}},
    {"type": "context",  "elements": [{"type": "mrkdwn", "text": ts}]},
    {"type": "divider"},
]
The message lands in whichever channel the Incoming Webhook is connected to. No stateful component, no external API call beyond the Slack webhook itself: the bridge processes a notification and returns in milliseconds.
Why this matters. Slack has become the de facto war-room for HPC operations teams. Routing OKA alerts into the right channel (whether that is #hpc-oncall, #sustainability-kpis, or #cluster-finance) means engineers see anomalies the moment they fire, without polling a dashboard. The emoji-coded severity gives an instant triage signal in a busy channel feed, and the code-block body preserves every line of alert detail without truncation.
Reaching every stakeholder: the AWS SES bridge
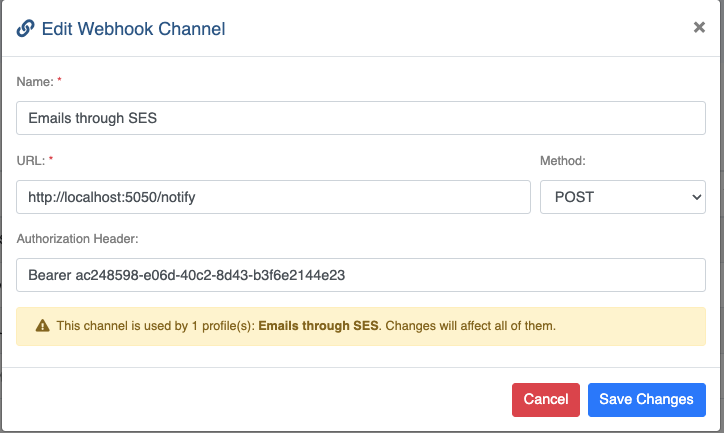
OKA natively supports SMTP-based email notifications out of the box: so if your infrastructure includes a standard mail relay or SMTP server, you do not need this bridge at all. This bridge is for teams that rely on cloud-native transactional email services instead: AWS Simple Email Service on Amazon Web Services, or equivalent offerings on other platforms such as Azure Communication Services (Email). If your team already routes all outbound email through SES, this bridge slots in naturally without standing up a separate SMTP relay.
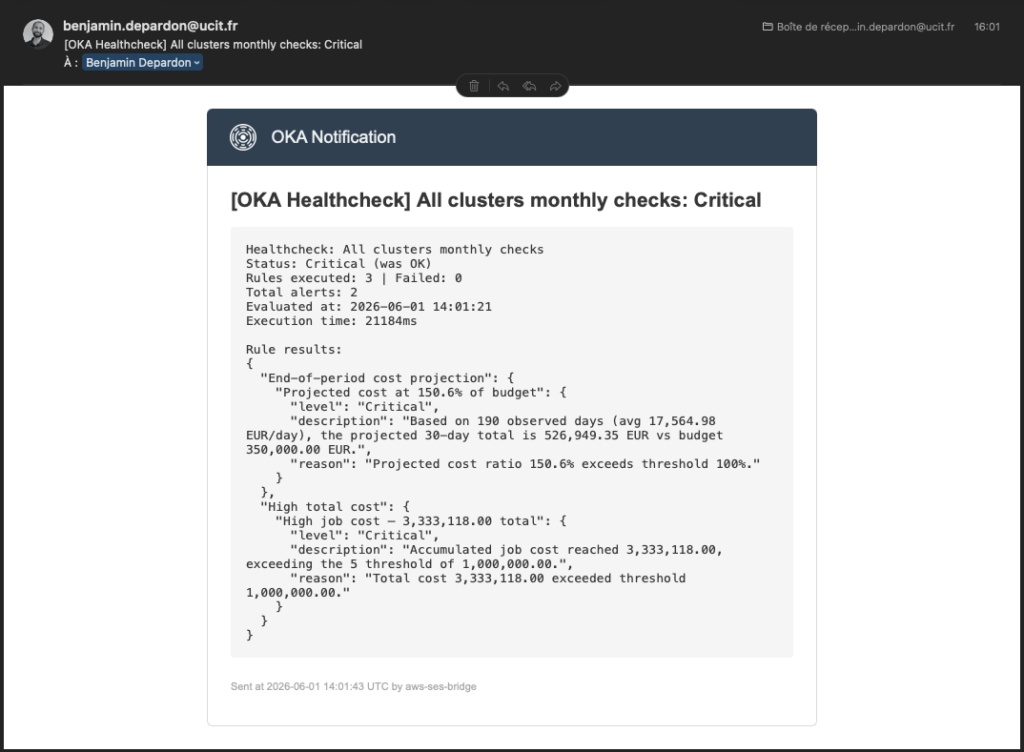
The bridge forwards each OKA notification as an email that includes both an HTML and a plain-text body: the HTML for mail clients that render it, the plain-text as a fallback for those that do not:
ses.send_email(
    Source=SES_FROM,
    Destination={"ToAddresses": TO_LIST, "CcAddresses": CC_LIST},
    Message={
        "Subject": {"Data": subject, "Charset": "UTF-8"},
        "Body": {
            "Text": {"Data": _build_body_text(subject, body), "Charset": "UTF-8"},
            "Html": {"Data": _build_body_html(subject, body), "Charset": "UTF-8"},
        },
    },
)
The HTML body includes an OKA-branded header, the alert subject as the email subject line, and the full alert body inside a <pre> block. The body text is HTML-escaped before insertion, so alert messages containing <, >, or & characters cannot break the template.
Authentication uses the standard boto3 credential chain: AWS_ACCESS_KEY_ID and AWS_SECRET_ACCESS_KEY via the .env file, or an IAM role attached to the EC2 instance running the bridge. The IAM role approach is recommended for production: no credentials in files, no rotation to manage.
| Variable | Required | Description |
|---|---|---|
SES_FROM_EMAIL | ✓ | Verified sender address in SES |
SES_TO_EMAILS | ✓ | Comma-separated recipient list |
SES_CC_EMAILS | Optional CC addresses | |
AWS_SES_REGION | SES region (default: eu-west-1) | |
AWS_ACCESS_KEY_ID / AWS_SECRET_ACCESS_KEY | Optional when using an IAM role |
Why this matters. Slack reaches the operations team; email reaches everyone else. Finance wants to know when the cost-per-project alert fires. Management wants visibility on sustainability anomalies. Compliance may require a logged, timestamped record of every critical alert. The SES bridge makes OKA’s alerting reach as wide as your distribution list, at the cost of a single environment variable.
Making alerts trackable: the Jira bridge
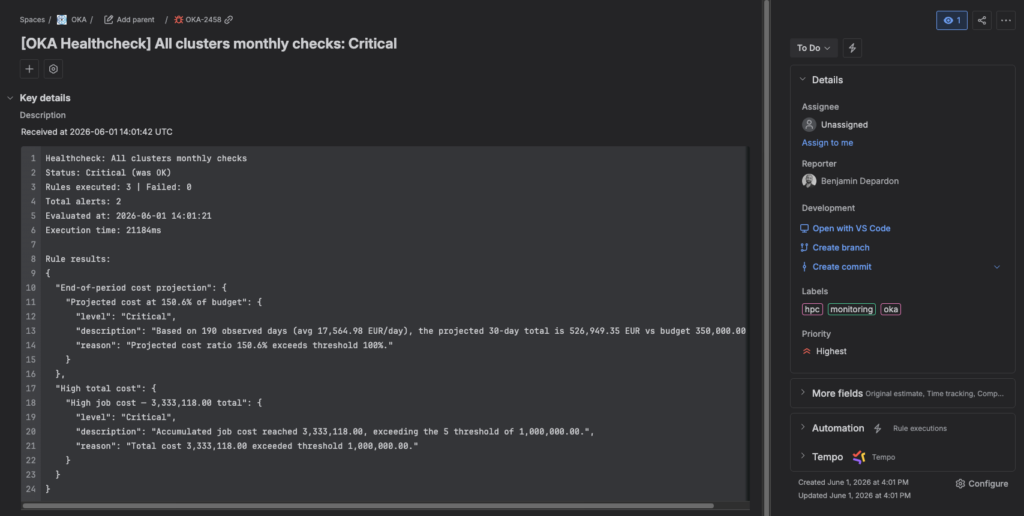
Not every alert needs to be acted on immediately, but every alert should be owned. The Jira bridge creates a Jira Cloud issue each time OKA fires a notification, turning an ephemeral alert into a tracked work item with a priority, an assignee, and a status: the natural lifecycle of an incident for teams that manage their operations backlog in Jira.
The bridge extracts the alert level from the subject line and maps it to a Jira priority through a configurable mapping:
# Default mapping, overridable via JIRA_PRIORITY_MAP environment variable:
# "critical:Highest,high:High,medium:Medium,low:Low,ok:Low"
level    = _level_from_subject(subject)      # "high", "critical", "medium", …
priority = PRIORITY_MAP.get(level, "Medium")
The issue description is formatted in Atlassian Document Format (ADF) (Jira Cloud’s structured rich-text format) with the full alert body in a code block, preserving every line of detail. Issues can optionally be auto-assigned to a specific Jira account and tagged with configurable labels, which is useful for filtering all OKA-generated issues in a project.
A key feature is deduplication. A sustained anomaly that triggers OKA’s healthcheck every 15 minutes would otherwise create 96 Jira issues per day: noise that would quickly bury the signal. The bridge uses an in-memory TTL cache to suppress duplicates within a configurable window (default: 30 minutes):
# In-memory TTL cache: 256 slots, TTL from JIRA_DEDUP_TTL_MINUTES (default 30 min)
_dedup_cache: TTLCache = TTLCache(maxsize=256, ttl=JIRA_DEDUP_TTL)

# On each incoming notification — return early if already seen recently
if subject in _dedup_cache:
    return _dedup_cache[subject]   # return the cached issue URL, skip creation

# ...create the Jira issue and register it for deduplication...
_dedup_cache[subject] = issue_url
The bridge routes requests through Atlassian’s api.atlassian.com gateway using a scoped API token with write:jira-work permission: the recommended approach for Jira Cloud integrations, distinct from classic token authentication. Required variables: JIRA_CLOUD_ID (your Atlassian cloud UUID), JIRA_SITE_URL (your organization’s Atlassian base URL), JIRA_EMAIL, JIRA_API_TOKEN, and JIRA_PROJECT_KEY.
Why this matters. Alerts that are seen but not tracked tend to be forgotten. Creating a Jira issue turns « we noticed a burst of job submission » into an assigned ticket with a due date and a visible audit trail. When the oncall engineer resolves the incident, the issue is closed; if the anomaly recurs after the dedup TTL expires, a new issue is created: maintaining a clean history of how often each healthcheck fires and how quickly each occurrence is resolved.
Closing the loop: the reporting bridge
The three bridges above all push OKA notifications outward: to Slack channels, email inboxes, and Jira boards. The reporting bridge does something qualitatively different: it calls back into OKA itself, using OKA’s own reporting and notification infrastructure to respond to the alert. OKA is both the origin of the webhook and the source of the response.
When a healthcheck alert fires, the bridge executes a four-step orchestration against the OKA REST API:
def _handle_notification(subject: str, body: str):
    # Extract the healthcheck name from "[OKA Healthcheck] <name>: <Level>"
    hc_name = _hc_name_from_subject(subject)

    # Step 1 — find the healthcheck in OKA to get the workload it monitors
    workload_id = _find_healthcheck_workload(hc_name)

    # Step 2 — find the notification profile that will handle PDF email delivery
    profile_id = _find_notification_profile_id(OKA_NOTIFICATION_PROFILE)

    # Step 3 — create a report scoped to that workload, with the alert body as description
    report_id = _create_report(workload_id, hc_name, body, profile_id)

    # Step 4 — trigger execution; OKA generates the PDF asynchronously and emails it
    _run_report(report_id)
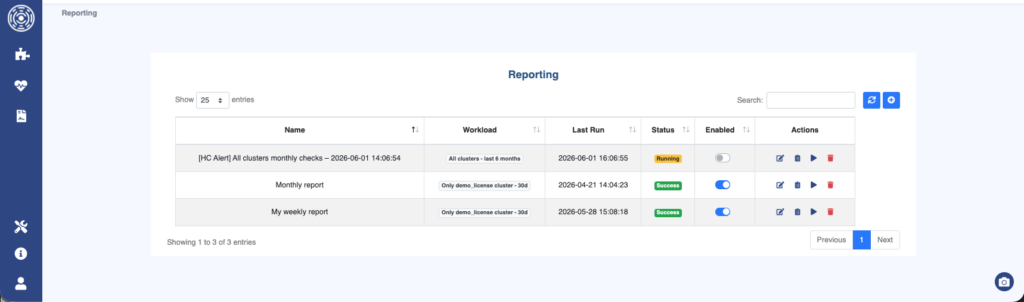
The report is created with two default pages: KPI (key performance indicators for the workload) and State (the current utilization breakdown). The full alert body is embedded as the report description, so the context of the anomaly is visible inside the document alongside the dashboard data. OKA then generates the PDF via its internal task queue and emails it through the configured notification profile.
The result: by the time the on-call engineer opens the Jira ticket or the alert email, the full report is already in their inbox. Not just a notification that something is wrong, but a rendered document showing what the affected workload looks like right now: the same dashboards they would consult manually anyway, delivered automatically.
Because the bridge must authenticate to the OKA API on every request, a module-level JWT token cache avoids re-authenticating unnecessarily:
# OKA issues 24-hour JWT tokens; refresh 60 s before expiry to avoid race conditions
if _token_cache["token"] and now < _token_cache["expires_at"]:
    return _token_cache["token"]   # reuse the cached token

r = httpx.post(f"{OKA_BASE_URL}/api/auth/",
               json={"username": OKA_USERNAME, "password": OKA_PASSWORD})
token = r.json()["access"]
_token_cache.update({"token": token, "expires_at": now + 86400 - 60})
The 60-second safety margin prevents multiple gunicorn workers from simultaneously discovering an expired token under concurrent load.
Configuration is minimal: OKA_BASE_URL, OKA_USERNAME, OKA_PASSWORD (a service account with report creation rights), and OKA_NOTIFICATION_PROFILE (the exact name of the OKA notification profile that will handle the PDF email delivery).
Why this matters. This bridge turns OKA’s alerting into a self-service diagnostics tool. A healthcheck fires, and within seconds (without any manual intervention) the relevant stakeholder has a PDF report covering the KPI and State of the workload that triggered the alarm. Context is delivered alongside the notification, not as a follow-up requiring manual navigation. For HPC operations teams that spend time locating the right dashboard after every alert, this closes the loop automatically.
Conclusion: complete the circuit
Data Enhancers, Healthcheck Rules, and Webhook Bridges form a complete observability circuit for an HPC cluster:
- Data Enhancers transform raw scheduler output into meaningful metrics: energy per job, carbon footprint per project, cost per user.
- Healthcheck Rules monitor those metrics on a schedule and fire structured alerts when anomalies or threshold violations are detected.
- Webhook Bridges route those alerts to the tools where action is taken: Slack channels, email inboxes, Jira backlogs, and automated reports.
Each bridge is independent. You can deploy just the Slack bridge today, add the Jira bridge when your team adopts incident tracking, and connect the reporting bridge once you want context delivered automatically alongside every alert.
Getting started with any bridge follows the same pattern:
- Clone the repository and
cdinto the bridge subdirectory you want to deploy. - Run
uv syncto create the virtual environment and install dependencies. - Copy
.env.exampleto.envand fill in the required variables. - Install the systemd service using the provided
.servicefile. - Create a Notification Profile in OKA pointing to
http://<your-host>:<port>/notify. - Trigger a test alert from the OKA Healthcheck panel and verify delivery.
If you build a bridge for a tool not yet covered (PagerDuty, Microsoft Teams, Amazon SNS, a custom ITSM platform) consider contributing it back to the repository. The collection grows through the collective experience of teams running real clusters.
OKA tells you what is happening on your cluster. Webhook bridges make sure the right people know about it, wherever they are.
Questions, feature requests, or contributions? Open an issue or a pull request in the
oka_webhooksrepository (coming soon!), or contact the UCit team.