
Extending OKA with Data Enhancers: real-world examples from OKA’s open-source library
Introduction
Managing an HPC cluster without proper observability is like flying blind. You know jobs are running, but you don’t know what they cost, how much energy they consume, or what their carbon footprint looks like. OKA, developed by UCit, was built to solve exactly this problem. It is an all-in-one HPC analytics platform that ships with over 20 native dashboards covering resource utilization, user behavior, job efficiency, sustainability reporting, and cost tracking — all without requiring custom development from your team.
Out of the box, OKA ingests data from your job scheduler (Slurm, PBS, LSF, …) and immediately surfaces actionable insights. But no two HPC centers are identical. Your energy monitoring stack, your pricing model, your project accounting conventions, and your sustainability commitments are unique to your organization. That is where Data Enhancers come in.
Data Enhancers are lightweight Python plugins that run inside OKA’s processing pipeline and add custom columns to your job data, or allow you to compute important metrics such as cost or carbon footprint. They can pull data from external APIs, query internal databases, invoke CLI tools, or simply reformat existing fields. The result is that OKA becomes tailored to your environment, surfacing metrics that matter specifically to you — carbon footprint per project, real electricity cost per user, power draw per job — without modifying OKA’s core.
This article walks through the open-source Data Enhancer library we maintain at UCit. Each enhancer addresses a concrete use case. Whether you are ready to adopt one as-is or use it as a starting point for your own implementation, these examples cover the most common enrichment needs we encounter at HPC centers.
The source code for all enhancers discussed here is available in the
oka_dataenhancersrepository.
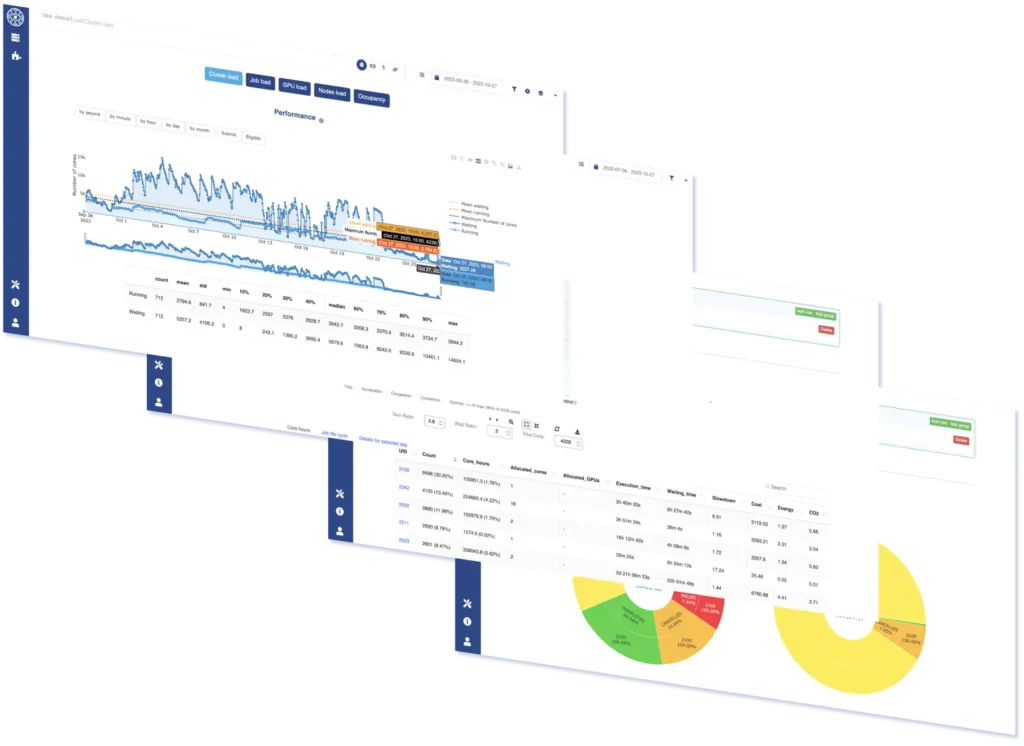
giving both IT staff and end-users instant visibility into the cluster’s behavior.
Anatomy of a Data Enhancer
Before diving into specific examples, let’s understand what a Data Enhancer looks like and how OKA manages it.
At its core, a Data Enhancer is a Python class that inherits from OKA’s DataEnhancer base class and implements a single run method. The method receives a Pandas DataFrame — one row per job, one column per scheduler field — and returns it enriched with whatever additional columns you add.
Here is the skeleton of a complete, working enhancer:
import pandas as pd
from applications.data_manager.lib.enhancer import DataEnhancer
from pydantic import BaseModel, Field

class MyCostCalculatorParams(BaseModel):
    CPU_HOUR_COST: float = Field(default=0.02, ge=0.0)
    GPU_HOUR_COST: float = Field(default=0.04, ge=0.0)
    GPU_PARTITION: str = Field(default="gpu")

class MyCostCalculator(DataEnhancer):
    params_model = MyCostCalculatorParams

    def run(self, data: pd.DataFrame, **kwargs) -> pd.DataFrame:
        data["COST"] = data["COREHOURS"] * self.params.CPU_HOUR_COST
        gpu_mask = data["PARTITION"] == self.params.GPU_PARTITION
        data.loc[gpu_mask, "COST"] += data.loc[gpu_mask, "GPUHOURS"] * self.params.GPU_HOUR_COST
return dataA few things are worth noting:
- Pydantic for parameters. The
params_modelclass declares every tunable parameter with its type, default, and validation rules. OKA reads these in the admin panel and exposes them as a form, so operators can adjust pricing or thresholds without touching code. - One file, no package. Each enhancer lives in a single
.pyfile. There is no__init__.py, no package structure to set up. DataEnhanceris provided by OKA. The base class is bundled with OKA and is not installed in your local development environment. It provides theself.paramsattribute (a validated instance of yourparams_model) and integrates with OKA’s logging infrastructure.
Writing and deploying an enhancer through the OKA UI.
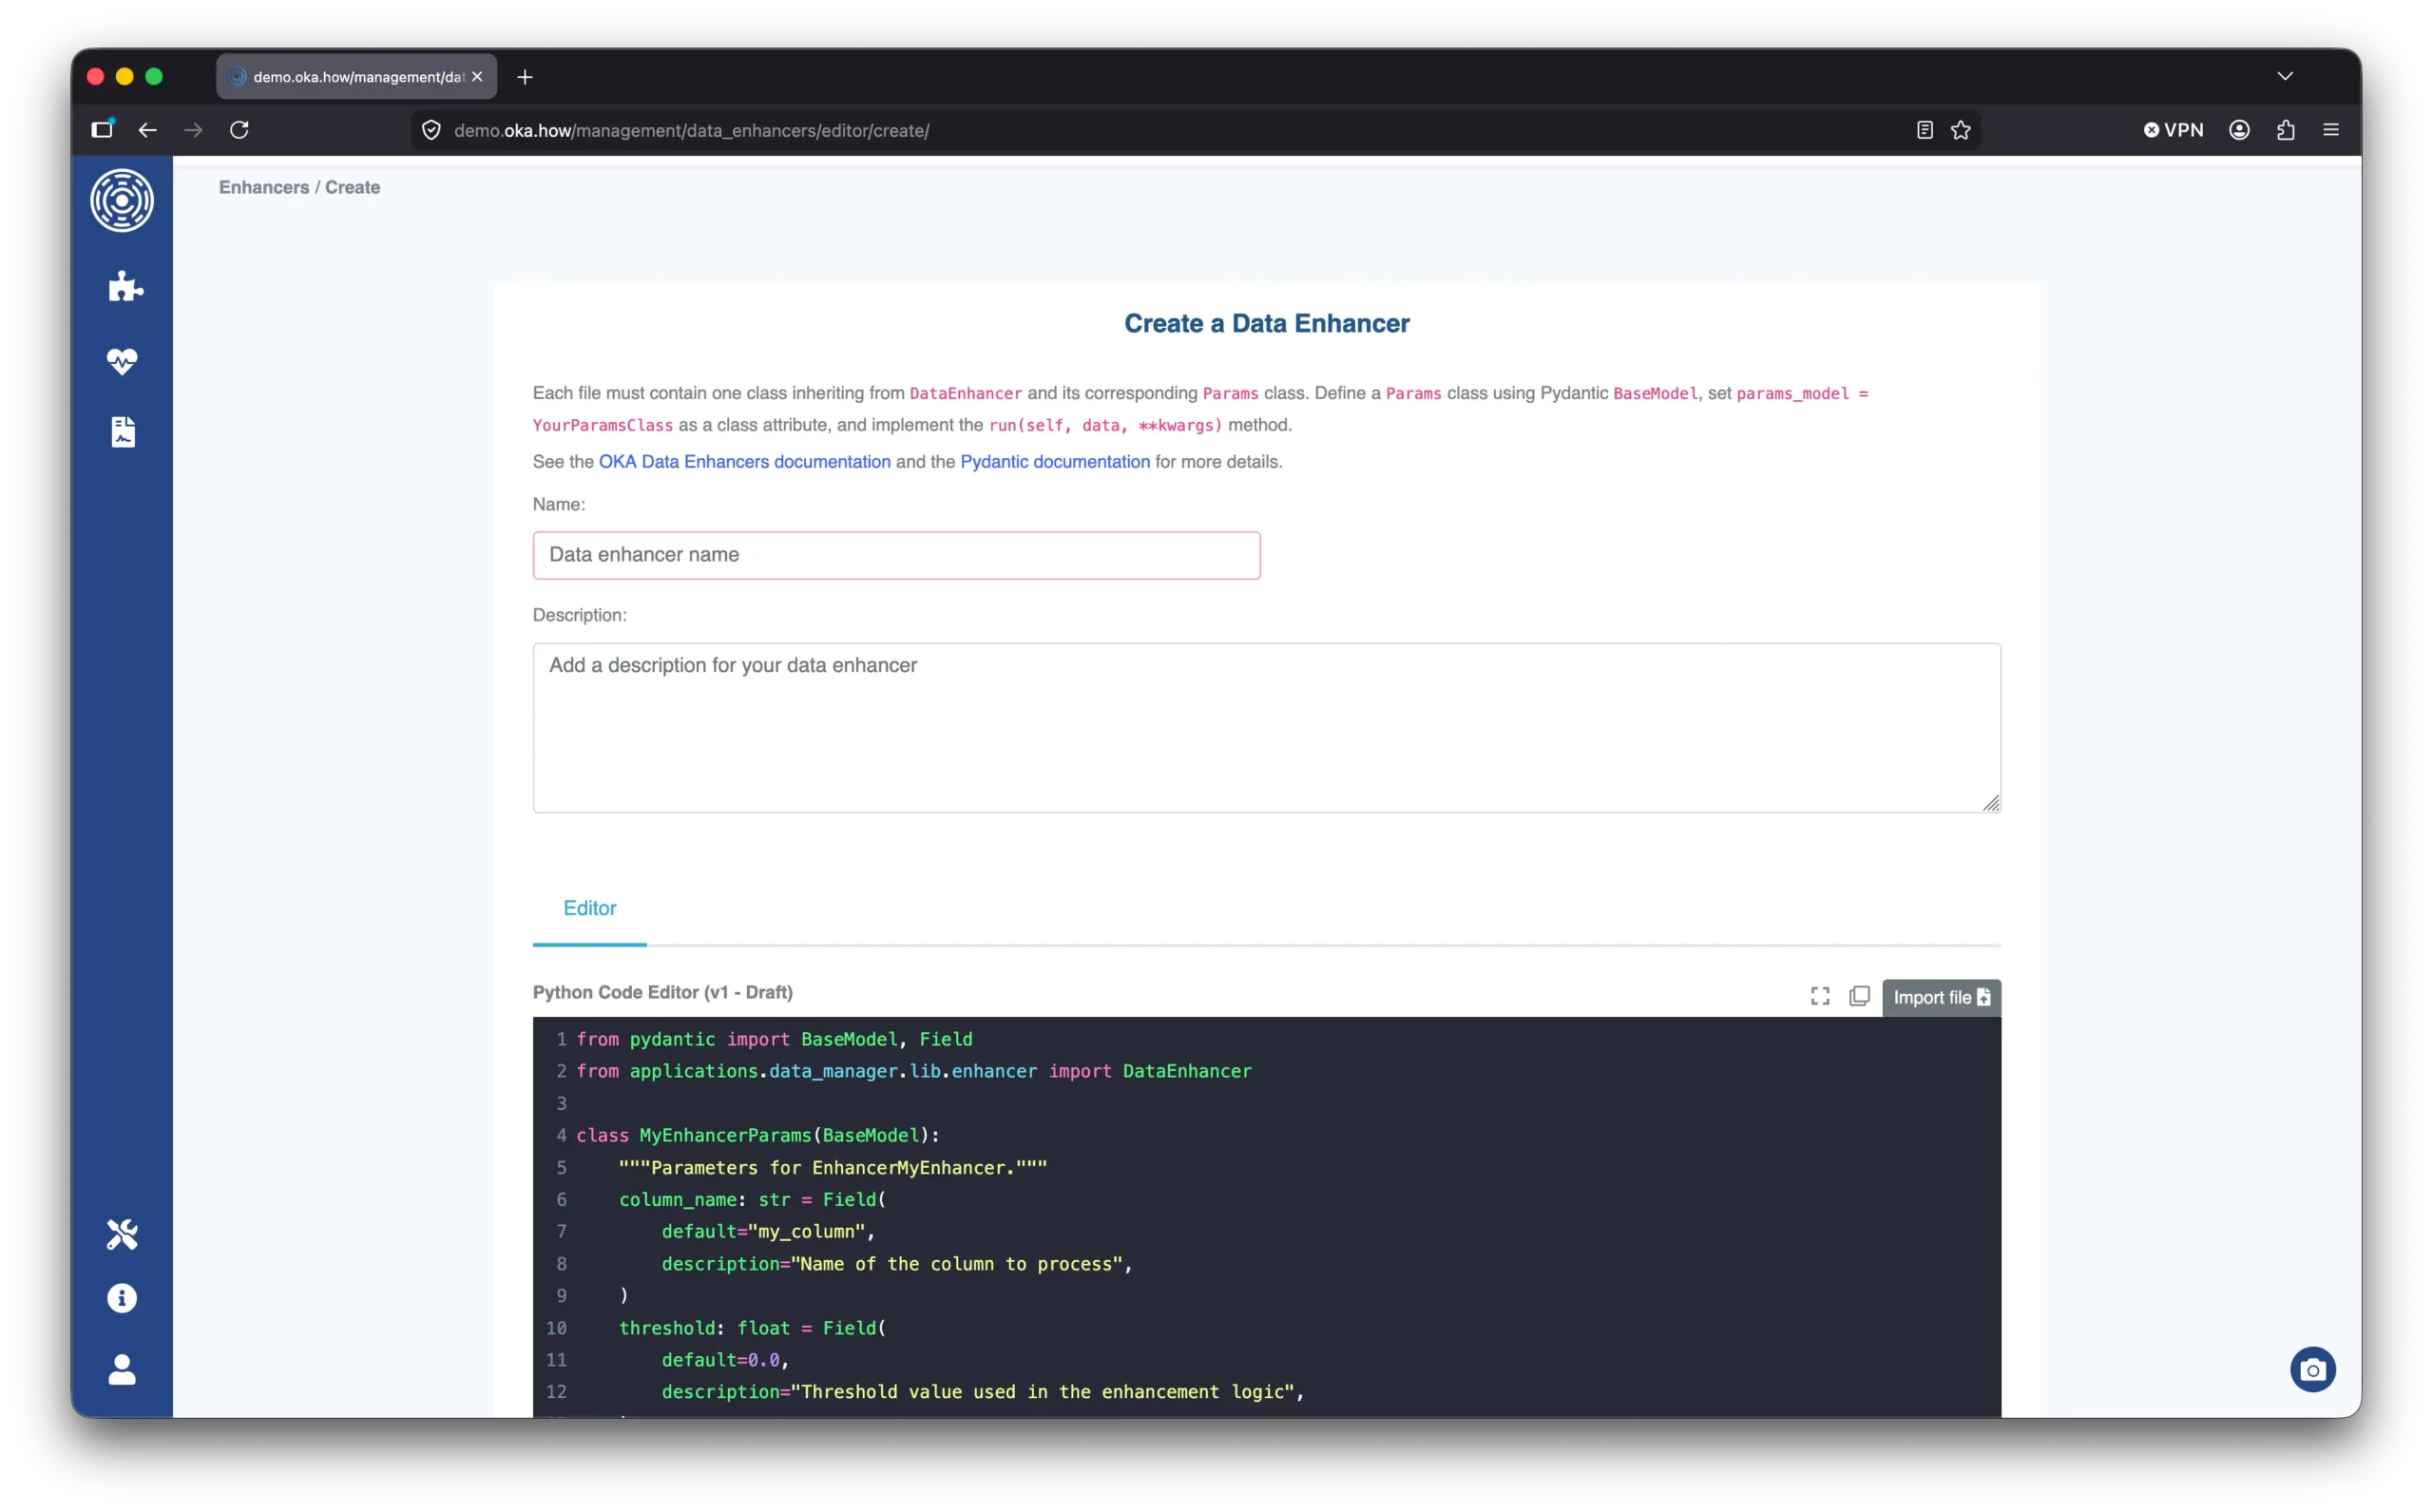
The latest version of OKA includes an integrated code editor directly in the Management → Data Enhancers admin panel. The workflow is entirely UI-driven:
- Create — click « Create Data Enhancer », give it a name and description, then write or paste your Python code into the built-in editor (CodeMirror with syntax highlighting, autocomplete, and the option to import a
.pyfile directly). The first save creates a draft. - Test in the sandbox — before committing to production, OKA lets you run the draft against a subset of real cluster jobs and inspect the output columns and logs side by side. This is the right moment to verify that your formula, API call, or field transformation behaves as expected on actual data.
- Publish — once satisfied, publish the draft. This creates an immutable, timestamped snapshot. No server restart is needed: OKA loads published enhancers dynamically at pipeline execution time.
- Assign to a cluster — navigate to the cluster’s configuration page, select the published enhancer in the Data Enhancers tab, and choose its position in the execution sequence (order matters when one enhancer produces a column that another consumes).
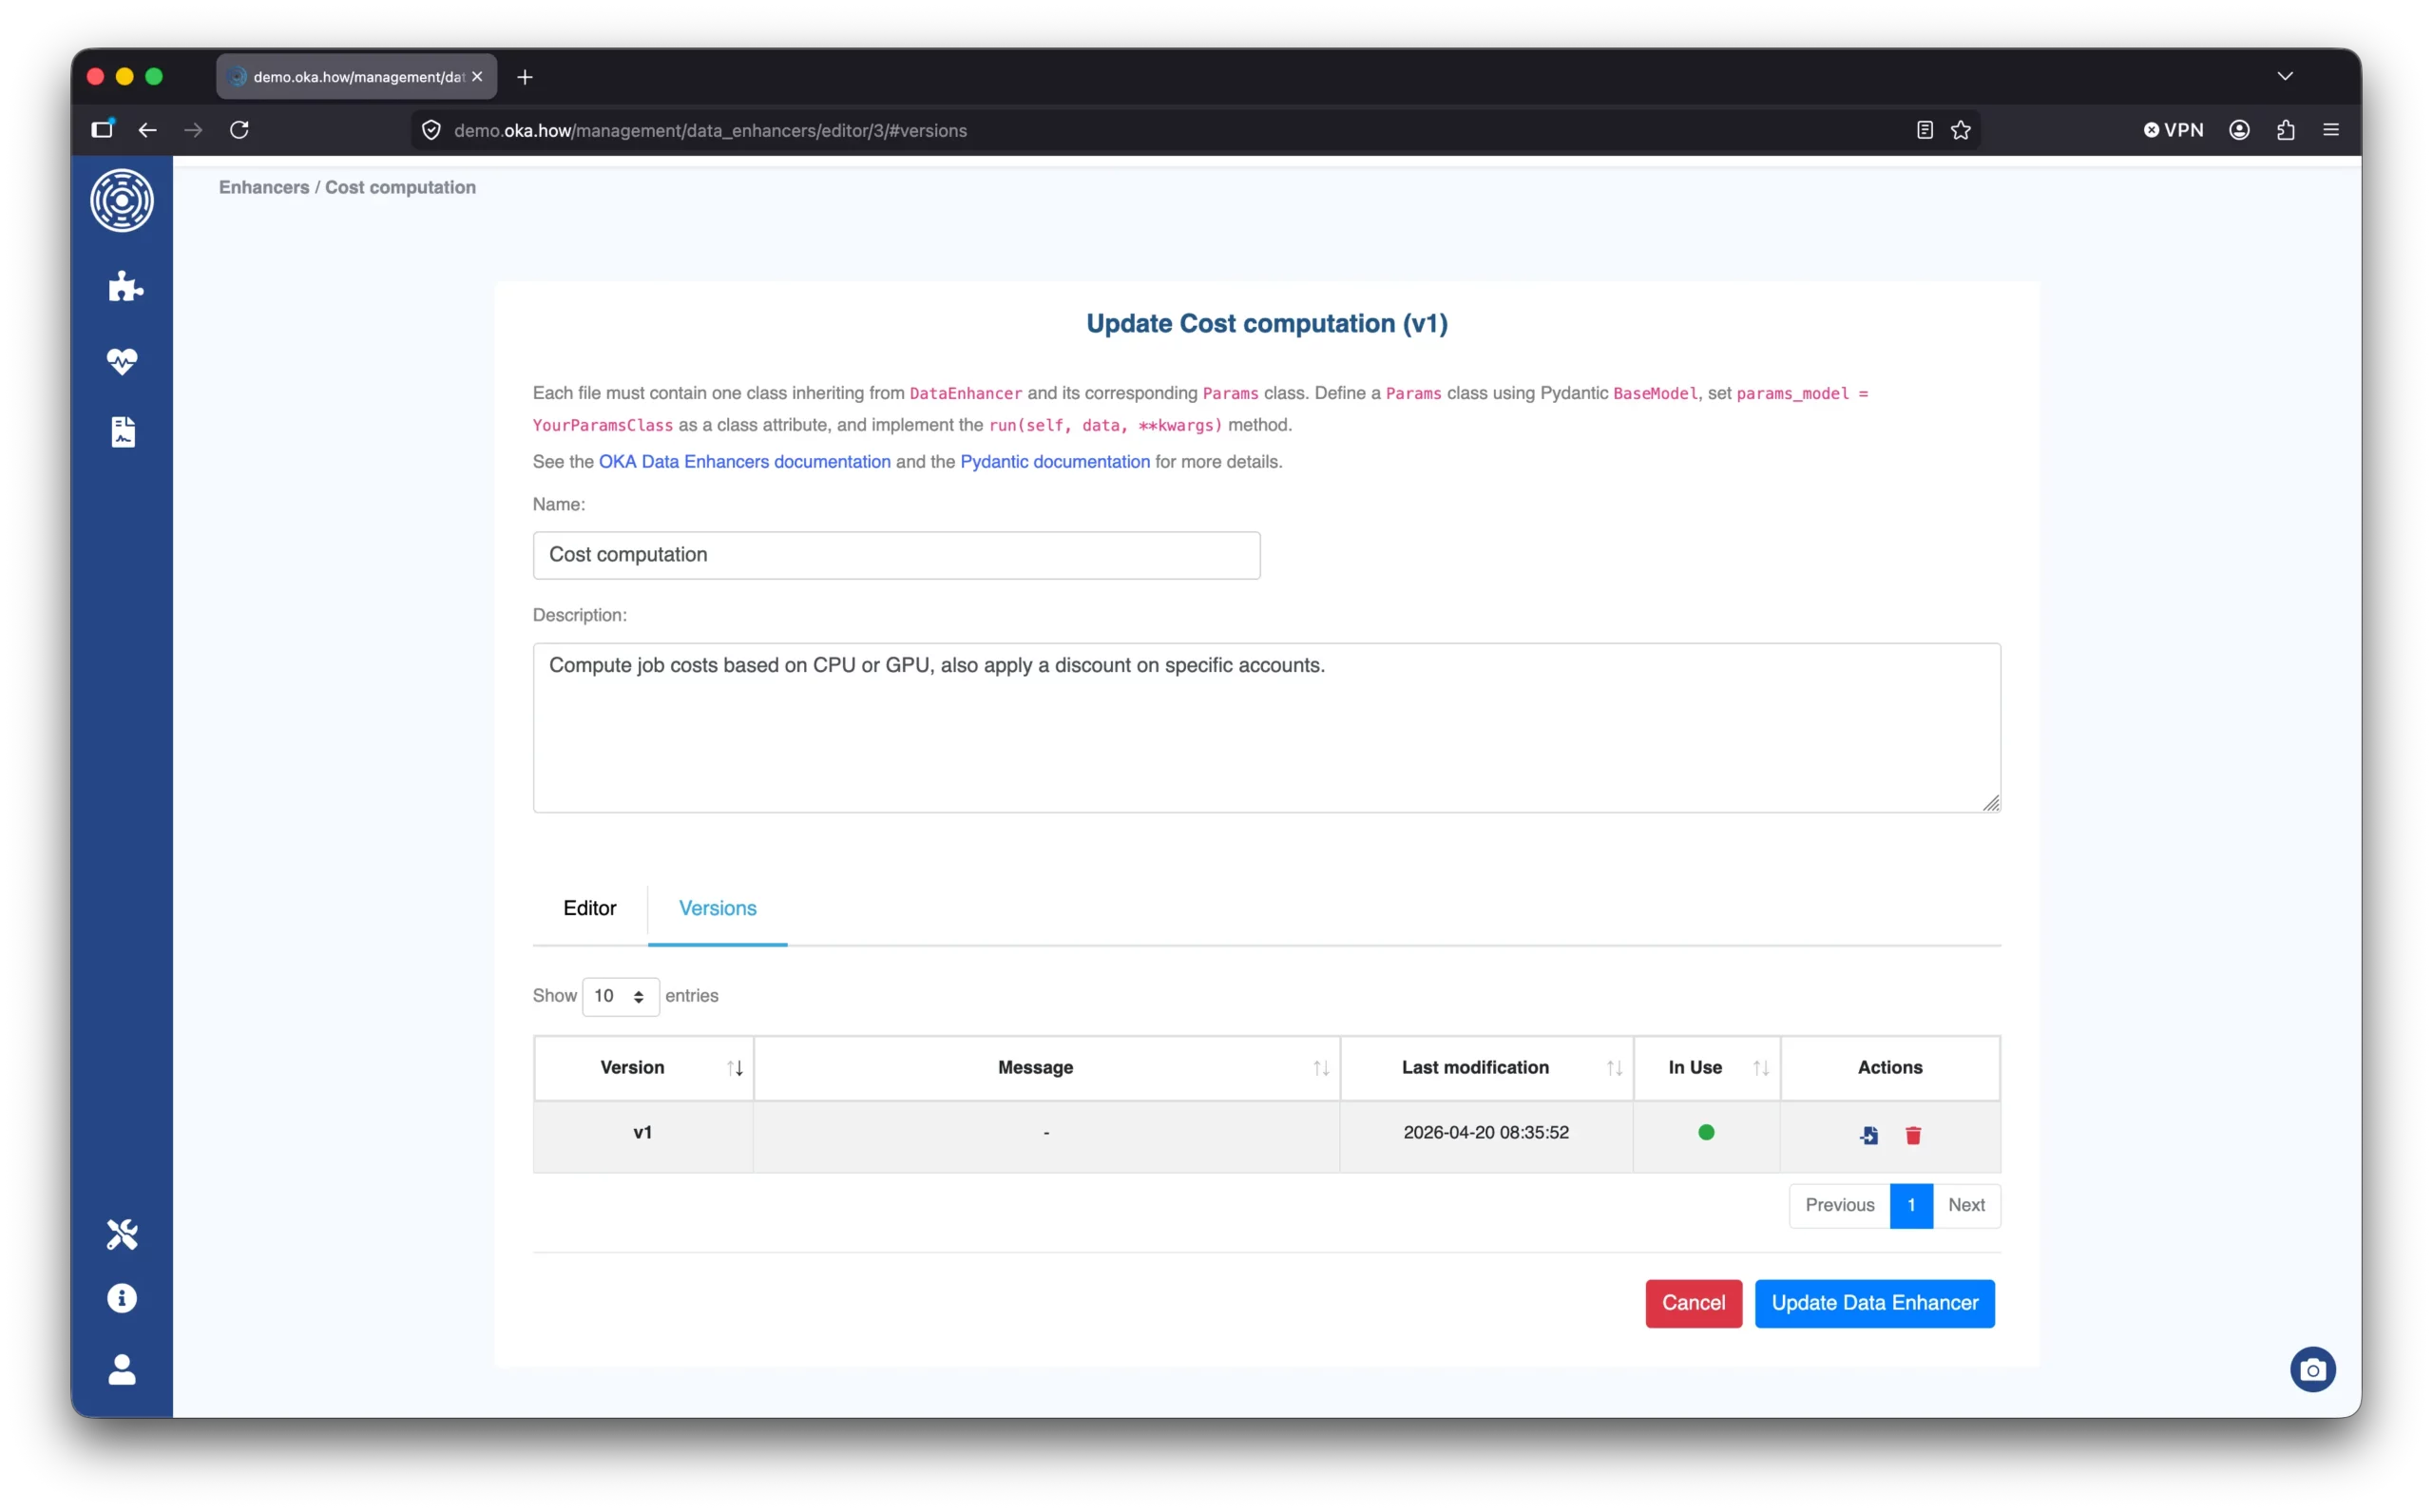
Versioning and auditability. Every save produces a new version. Published versions are immutable — editing an existing enhancer always creates a new draft, which must go through the publish step before it becomes active. This matters in practice: the way job cost or carbon footprint is computed can change over time as pricing models or grid data sources evolve, and the version history gives you a clear audit trail of which formula was active during which period.
Pipeline stages. Enhancers can run at two points: during ingestion (enriching jobs as they are recorded) or retroactively to processe already-stored jobs in chunks. The retroactive mode is useful when you want to backfill new metrics on historical data without re-ingesting from the scheduler.
Full documentation is available at doc.oka.how under the admin guide → Data Enhancers section.
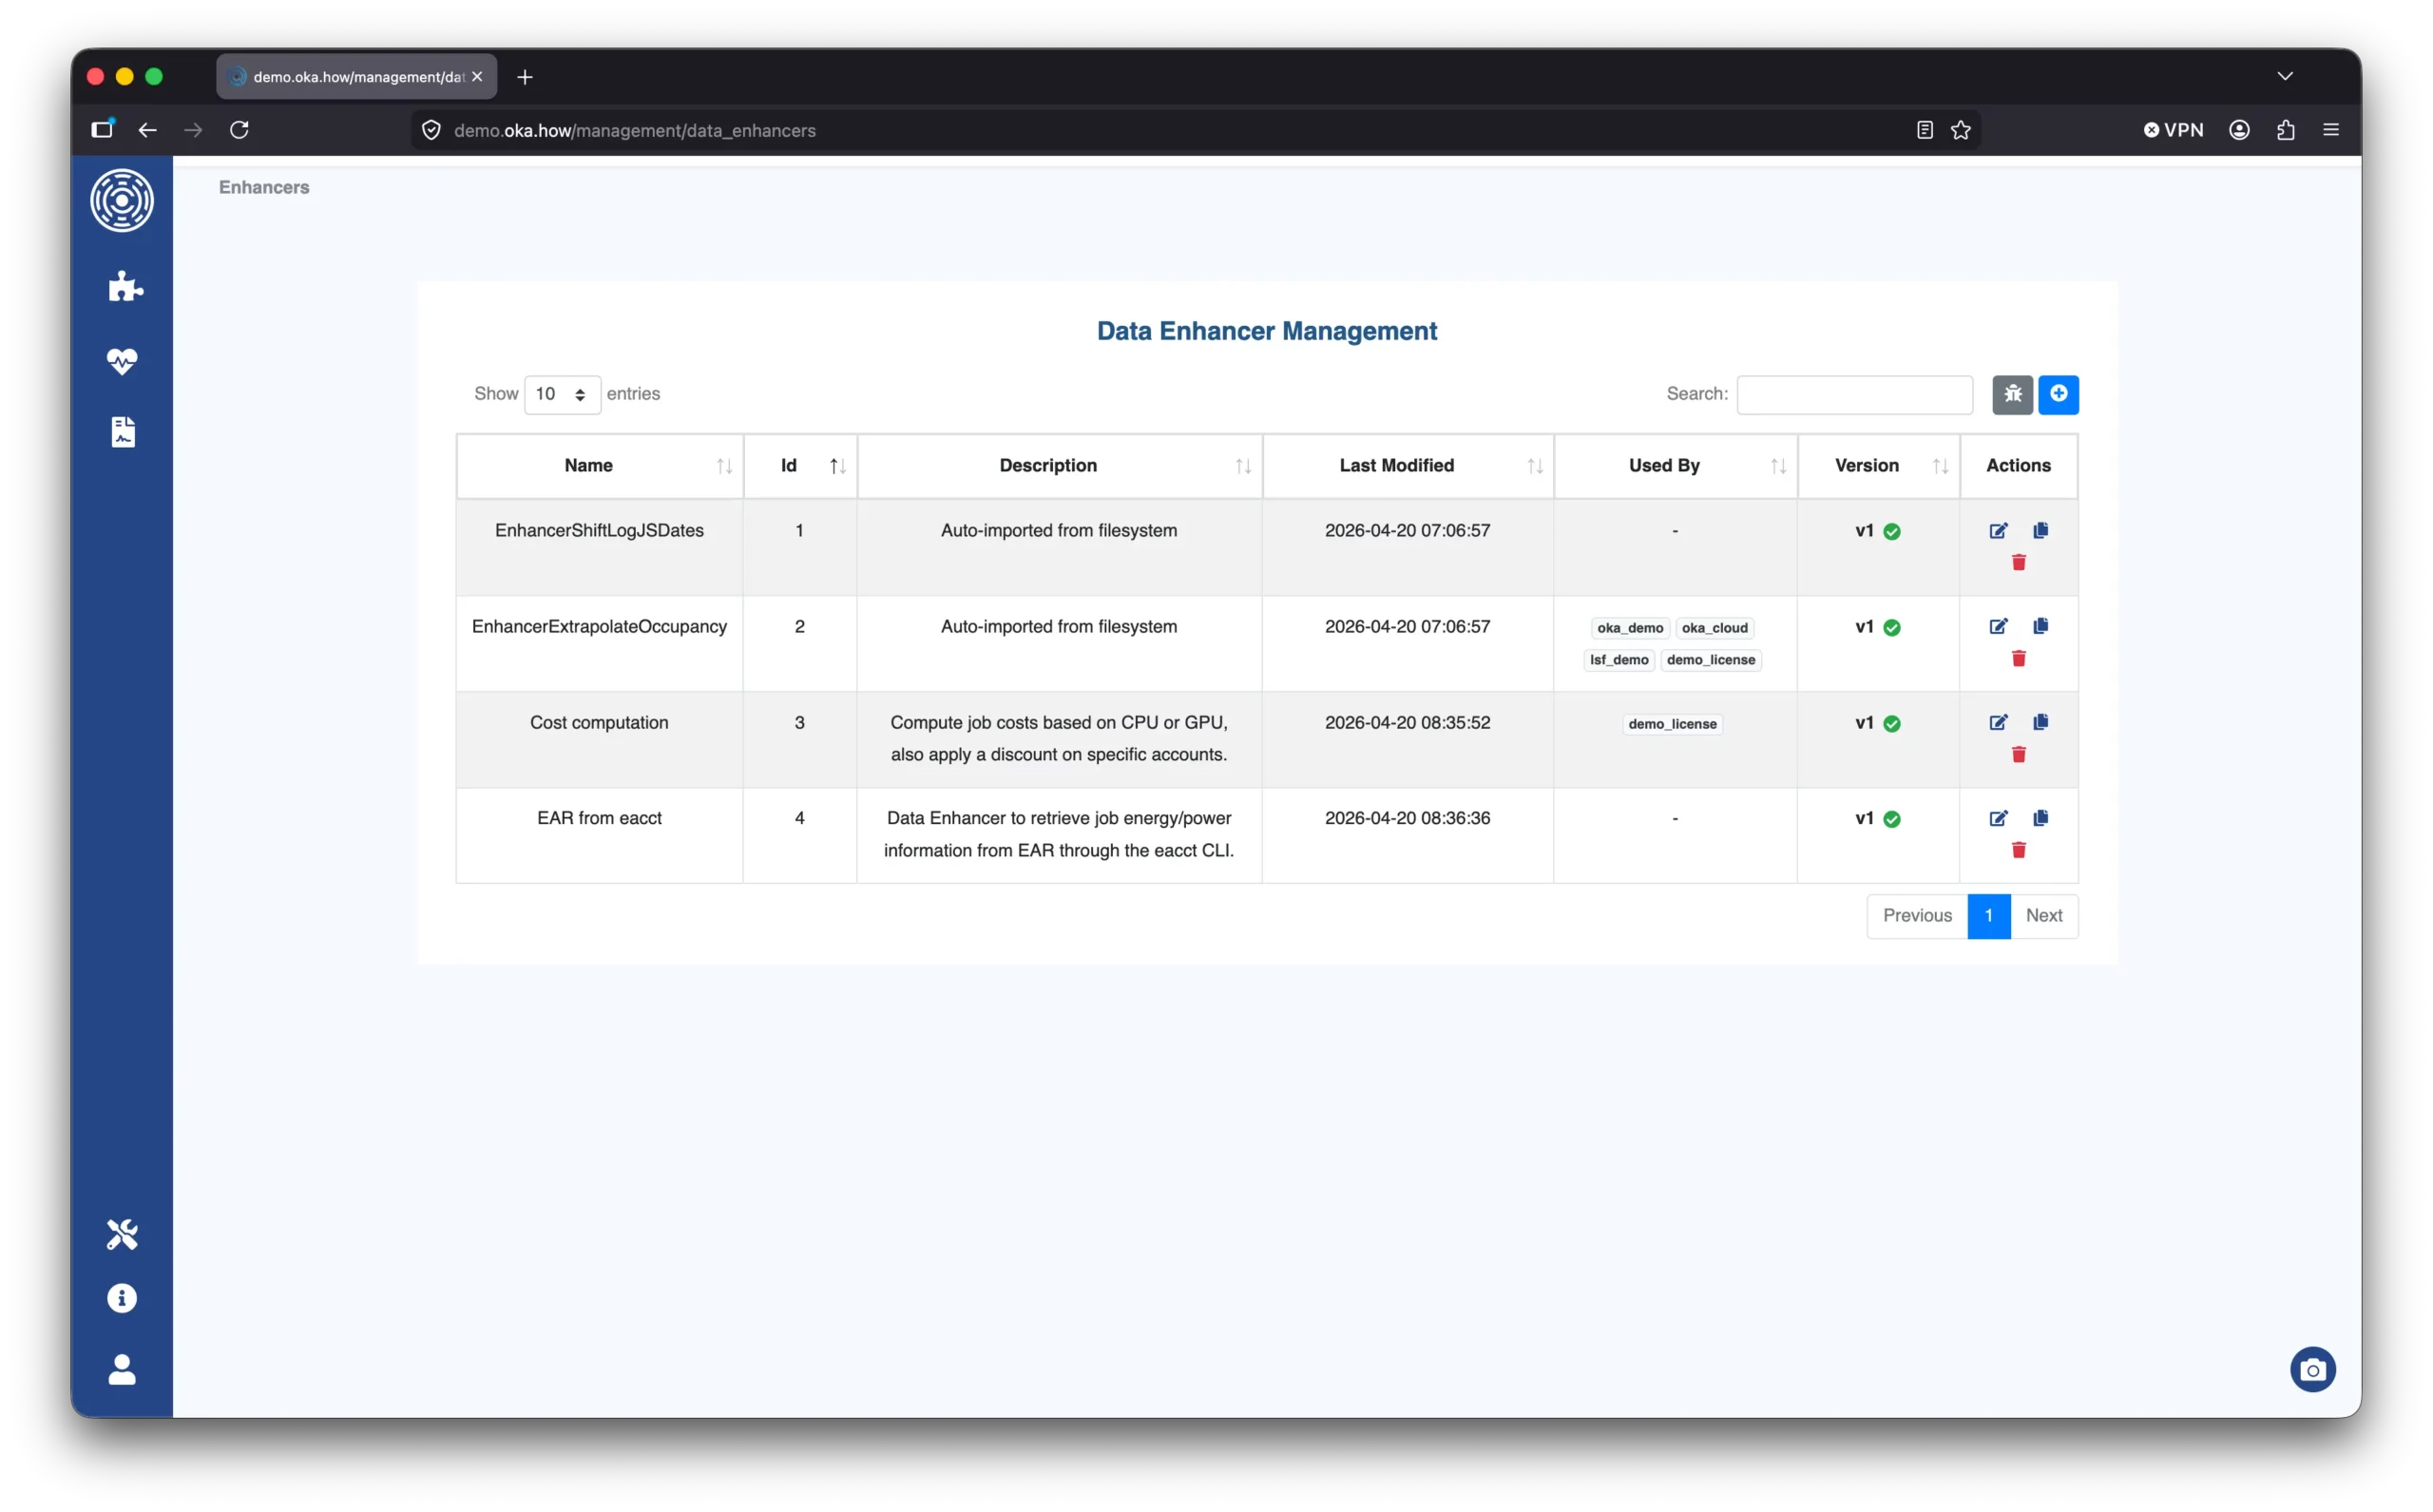
The Enhancers — A Use-Case Tour
Measuring Energy Consumption: EAR Integration
The scheduler knows when a job ran and on which nodes. It does not know how much electricity that job actually consumed. Bridging that gap requires an energy monitoring layer, and EAR (Energy Aware Runtime) is one of the most widely deployed solutions on FLOPS-intensive clusters.
The repository provides two enhancers for pulling EAR data into OKA. They add the same four columns — Energy (Joules), Power (average watts), Minimum_Power, and Maximum_Power — but source the data differently depending on your infrastructure setup.
Via the EAR database (ear_from_db.py)
This variant connects directly to the EAR MySQL database and aggregates per-job power metrics:
class EnhancerEARFromDBParams(BaseModel):
    host: str = Field(default="localhost", description="EAR database host address")
    port: int = Field(default=3306, description="EAR database port number")
    user: str = Field(description="EAR database username (must have read access to the Applications and Power_signatures tables)")
    password: str = Field(description="Password for the configured database user")
database: str = Field(default="EAR", description="EAR database name")It issues a single query that joins EAR’s Applications and Power_signatures tables, computes average, minimum and maximum DC power, and calculates total energy as Power × Time. Only jobs whose IDs are at or above the minimum ID in the current batch are queried, keeping the database load proportional to the batch size rather than to the full job history.
This approach is ideal when OKA has direct network access to the EAR database and you are comfortable providing read credentials.
Via the eacct CLI tool (ear_from_eacct.py)
If you would rather not expose database credentials to the OKA process, eacct — EAR’s built-in accounting command — provides the same information through a command-line interface:
class EnhancerEARFromEacctParams(BaseModel):
    eacct_path: str = Field(
        default="eacct",
        description="Path to the eacct executable; use a full path if eacct is not on the system PATH",
    )
    batch_size: int = Field(
        default=100,
        description="Maximum number of job IDs per eacct invocation; reduce if hitting shell argument-length limits",
    )
    ear_etc: str | None = Field(
        default=None,
        description="Path to the EAR configuration directory; sets the EAR_ETC environment variable when provided",
    )
    ear_install_path: str | None = Field(
        default=None,
        description="EAR installation prefix; sets EAR_INSTALL_PATH when provided",
    )
    env_vars: dict[str, str] = Field(
        default_factory=dict,
        description="Additional environment variables forwarded to the eacct process",
)The enhancer runs eacct -c no_file -n all -j in batches of up to batch_size IDs (to stay within command-line argument limits), parses the semicolon-separated CSV output, and calculates energy as Power × Time. The « No jobs found » case is handled gracefully, and each batch failure is logged as a warning rather than aborting the whole run.
Why this matters. Without energy data, OKA can show you when jobs ran but not what they cost in electricity. Once Energy is populated, the carbon and cost enhancers described below can immediately turn it into actionable sustainability and financial metrics.
Carbon Footprint and Electricity Cost: RTE éCO2mix + ENTSO-E
Sustainability reporting and energy cost attribution are two of the most frequent requests we receive from HPC finance and sustainability teams. The carbon_cost_RTE.py enhancer addresses both in a single plugin.
It enriches each job with four new columns:
| Column | Unit | Description |
|---|---|---|
CO2 |
kgCO2eq | Carbon footprint of the job |
elec_cost_eur |
€ | Wholesale electricity cost |
avg_carbon_intensity_gco2_kwh |
gCO2eq/kWh | Time-weighted mean grid intensity over the job |
avg_spot_price_eur_mwh |
€/MWh | Time-weighted mean day-ahead spot price over the job |
The two data sources are:
- RTE éCO2mix (via the ODRÉ open-data API) — carbon intensity of the French electricity grid, updated every 15 minutes, no API key required. It reflects the direct combustion emissions of the power mix as published by the French grid operator RTE.
- ENTSO-E Transparency Platform — wholesale day-ahead spot prices for the French bidding zone, at 1-hour granularity. This requires a free API key (obtainable by emailing
transparency@entsoe.eu).
The calculation is straightforward in concept but careful in implementation:
# Energy in kWh
elec_kwh = data[oka_constants.ENERGY] / 3_600_000

# One API call covers the entire batch [min(START), max(END)]
t_min = data["START"].min()
t_max = data["END"].max()
ci_series = RTEClient().get_carbon_intensity(t_min, t_max, cache)

# Per-job time-weighted mean of the carbon intensity series
avg_ci = data.apply(
    lambda r: _time_weighted_mean(ci_series, r["START"], r["END"]),
    axis=1,
)
# kWh × gCO2/kWh ÷ 1000 = kgCO2
data["CO2"] = elec_kwh * avg_ci / 1000The _time_weighted_mean function handles a subtle but important edge case: jobs shorter than the data source’s granularity (e.g. a 5-minute job against 15-minute RTE data). In that case, Series.asof() is used to return the value of the active bucket directly, rather than trying to average over an empty slice.
To avoid hammering public APIs on every pipeline run, the enhancer maintains a local SQLite cache (timeseries.db) with a 24-hour TTL. All time series are stored as UTC ISO 8601 strings so that lexicographic ordering equals chronological ordering, enabling simple range queries without any date parsing.
The enable_carbon and enable_cost parameters let you switch each feature on or off independently — useful when, for example, you want carbon tracking but have not yet obtained an ENTSO-E API key:
class EnhancerCarbonCostParams(BaseModel):
    country_code: str = Field(default="FR")
    enable_carbon: bool = Field(default=True)
    enable_cost: bool = Field(default=True)
Current scope. This enhancer currently supports French grid data (RTE and the French ENTSO-E bidding zone). The architecture is designed to be extended:
country_codeis a reserved parameter, and theRTEClient/ENTSOEClientclasses can be supplemented with equivalents for other countries’ grid operators. Contributions are welcome.What this estimate covers — and what it does not. The
CO2column computed with this Data Enhancer reflects the operational emissions of the computing nodes alone: measured energy × grid carbon intensity. It deliberately excludes several contributors that can represent a significant share of an HPC system’s total carbon footprint:
- Lifecycle emissions — manufacturing, transport, and end-of-life disposal of servers, networking hardware, and storage.
- Infrastructure overhead — storage systems, service nodes, management infrastructure, and cooling that are not captured by per-job IPMI/RAPL measurements.
- PUE and datacenter losses — the energy consumed by cooling, power distribution, and UPS systems is not factored in unless the raw energy readings already account for it.
For a complete and auditable carbon assessment of an HPC system — one that covers the full lifecycle and the entire datacenter footprint — a dedicated analysis is required. Kyanopi provides this kind of in-depth environmental assessment for HPC infrastructures.
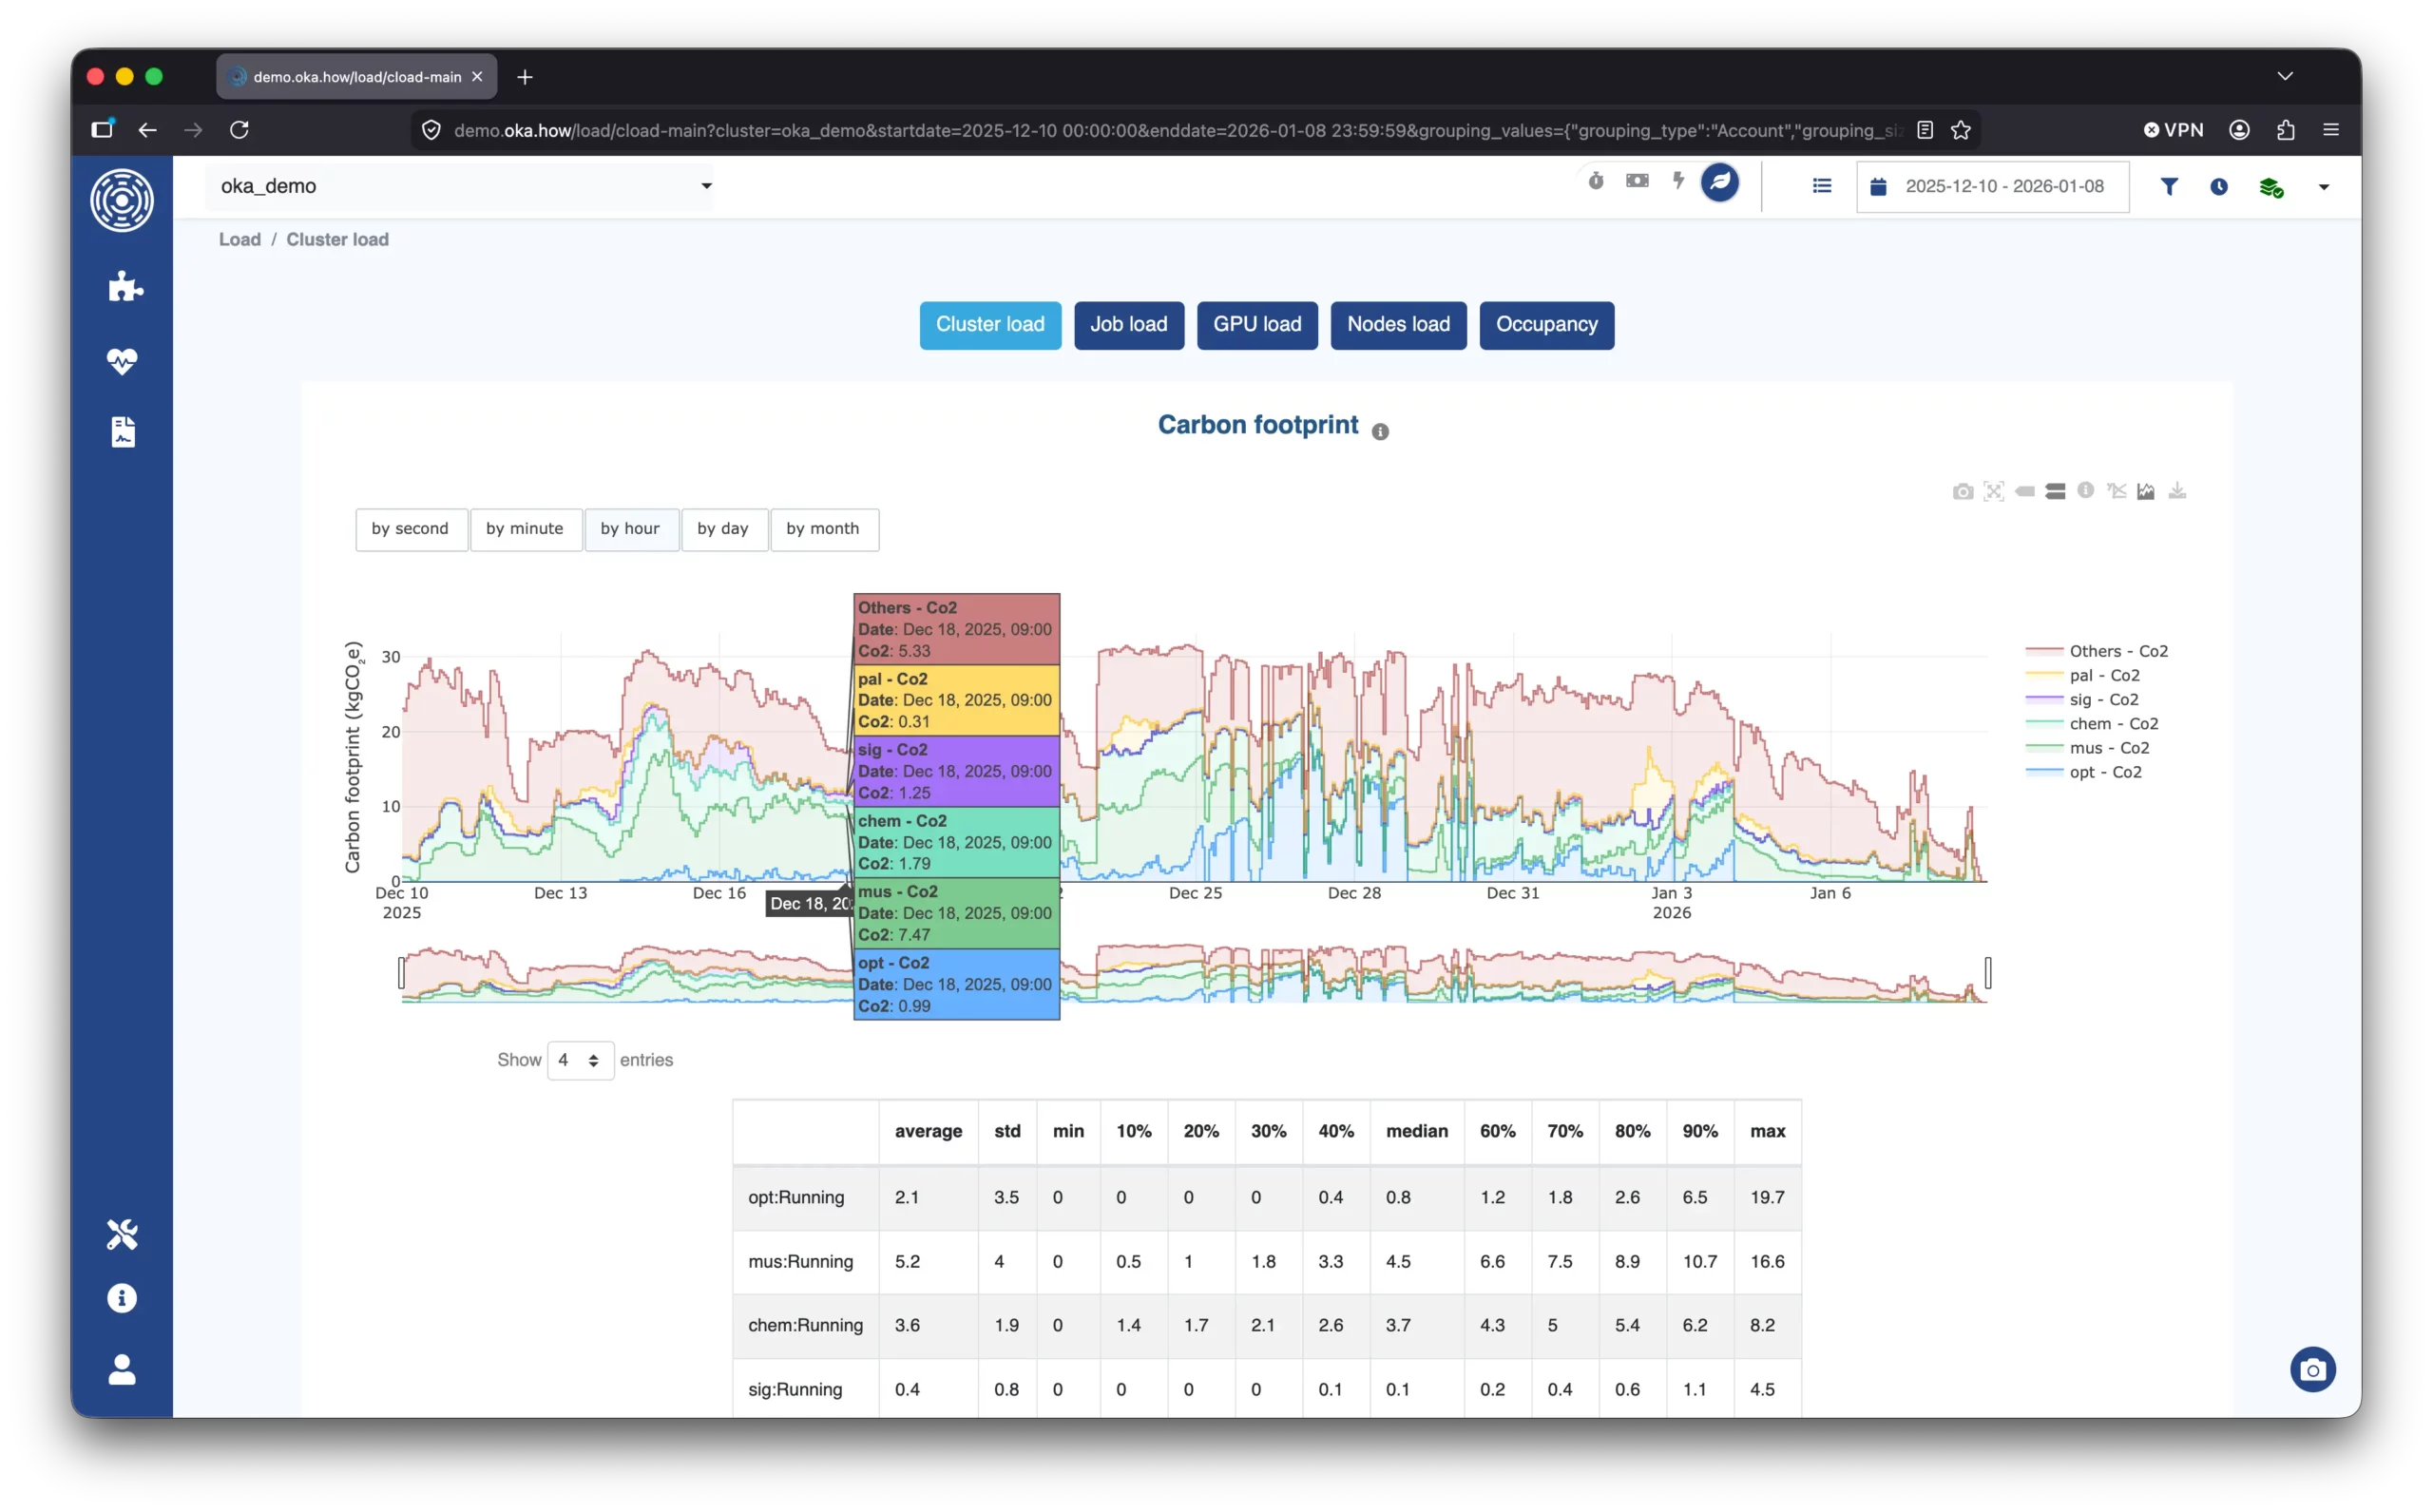
Why this matters. Multiplying measured energy by grid carbon intensity turns raw compute time into a sustainability KPI — per-project CO2 budgets, cluster-level carbon reporting, and eventually, carbon-aware scheduling decisions. The electricity cost column adds a financial dimension: organizations can cross-reference actual spot prices with their internal chargeback rates, or expose the variable cost of compute to users to incentivize off-peak submissions.
Job Cost Accounting
Internal chargebacks are a universal requirement: research computing centers need to allocate costs to departments, projects, or grants. The costs_demo.py enhancer provides a ready-to-adapt template for exactly this use case.
It implements a realistic three-tier pricing model:
# 1. Default cost for all jobs
data["COST"] = data["COREHOURS"] * self.params.CPU_HOUR_COST

# 2. Discounted rate for contract accounts (regex match)
account_mask = data["ACCOUNT"].str.match(self.params.DISC_ACCOUNT)
data.loc[account_mask, "COST"] = (
    data.loc[account_mask, "COREHOURS"] * self.params.DISC_ACCOUNT_CPU_HOURS_COST
)

# 3. GPU surcharge on top for jobs in the GPU partition
gpu_mask = data["PARTITION"] == self.params.GPU_PARTITION
data.loc[gpu_mask, "COST"] += (
    data.loc[gpu_mask, "GPUHOURS"] * self.params.GPU_HOUR_COST
)All pricing constants are Pydantic fields with defaults:
class MyCostCalculatorParams(BaseModel):
    CPU_HOUR_COST: float = Field(default=0.02, ge=0.0)   # €/core-hour
    GPU_HOUR_COST: float = Field(default=0.04, ge=0.0)   # €/GPU-hour (surcharge)
    GPU_PARTITION: str = Field(default="gpu")
    DISC_ACCOUNT_CPU_HOURS_COST: float = Field(default=0.01, ge=0.0)
DISC_ACCOUNT: str = Field(default=r"contract_fusion_.*")Because the parameters are declared this way, an operator can update the CPU rate or add a new discount pattern directly from the OKA admin panel — no code change, no server restart required (only the pipeline re-run).
The enhancer is entirely self-contained: no external APIs, no additional dependencies. It is the fastest enhancer to adopt from this library, and it covers the most common chargeback patterns we encounter at HPC centers. From here, you can extend it to read pricing tables from a database, apply time-of-day rates, or integrate with your institution’s financial system.
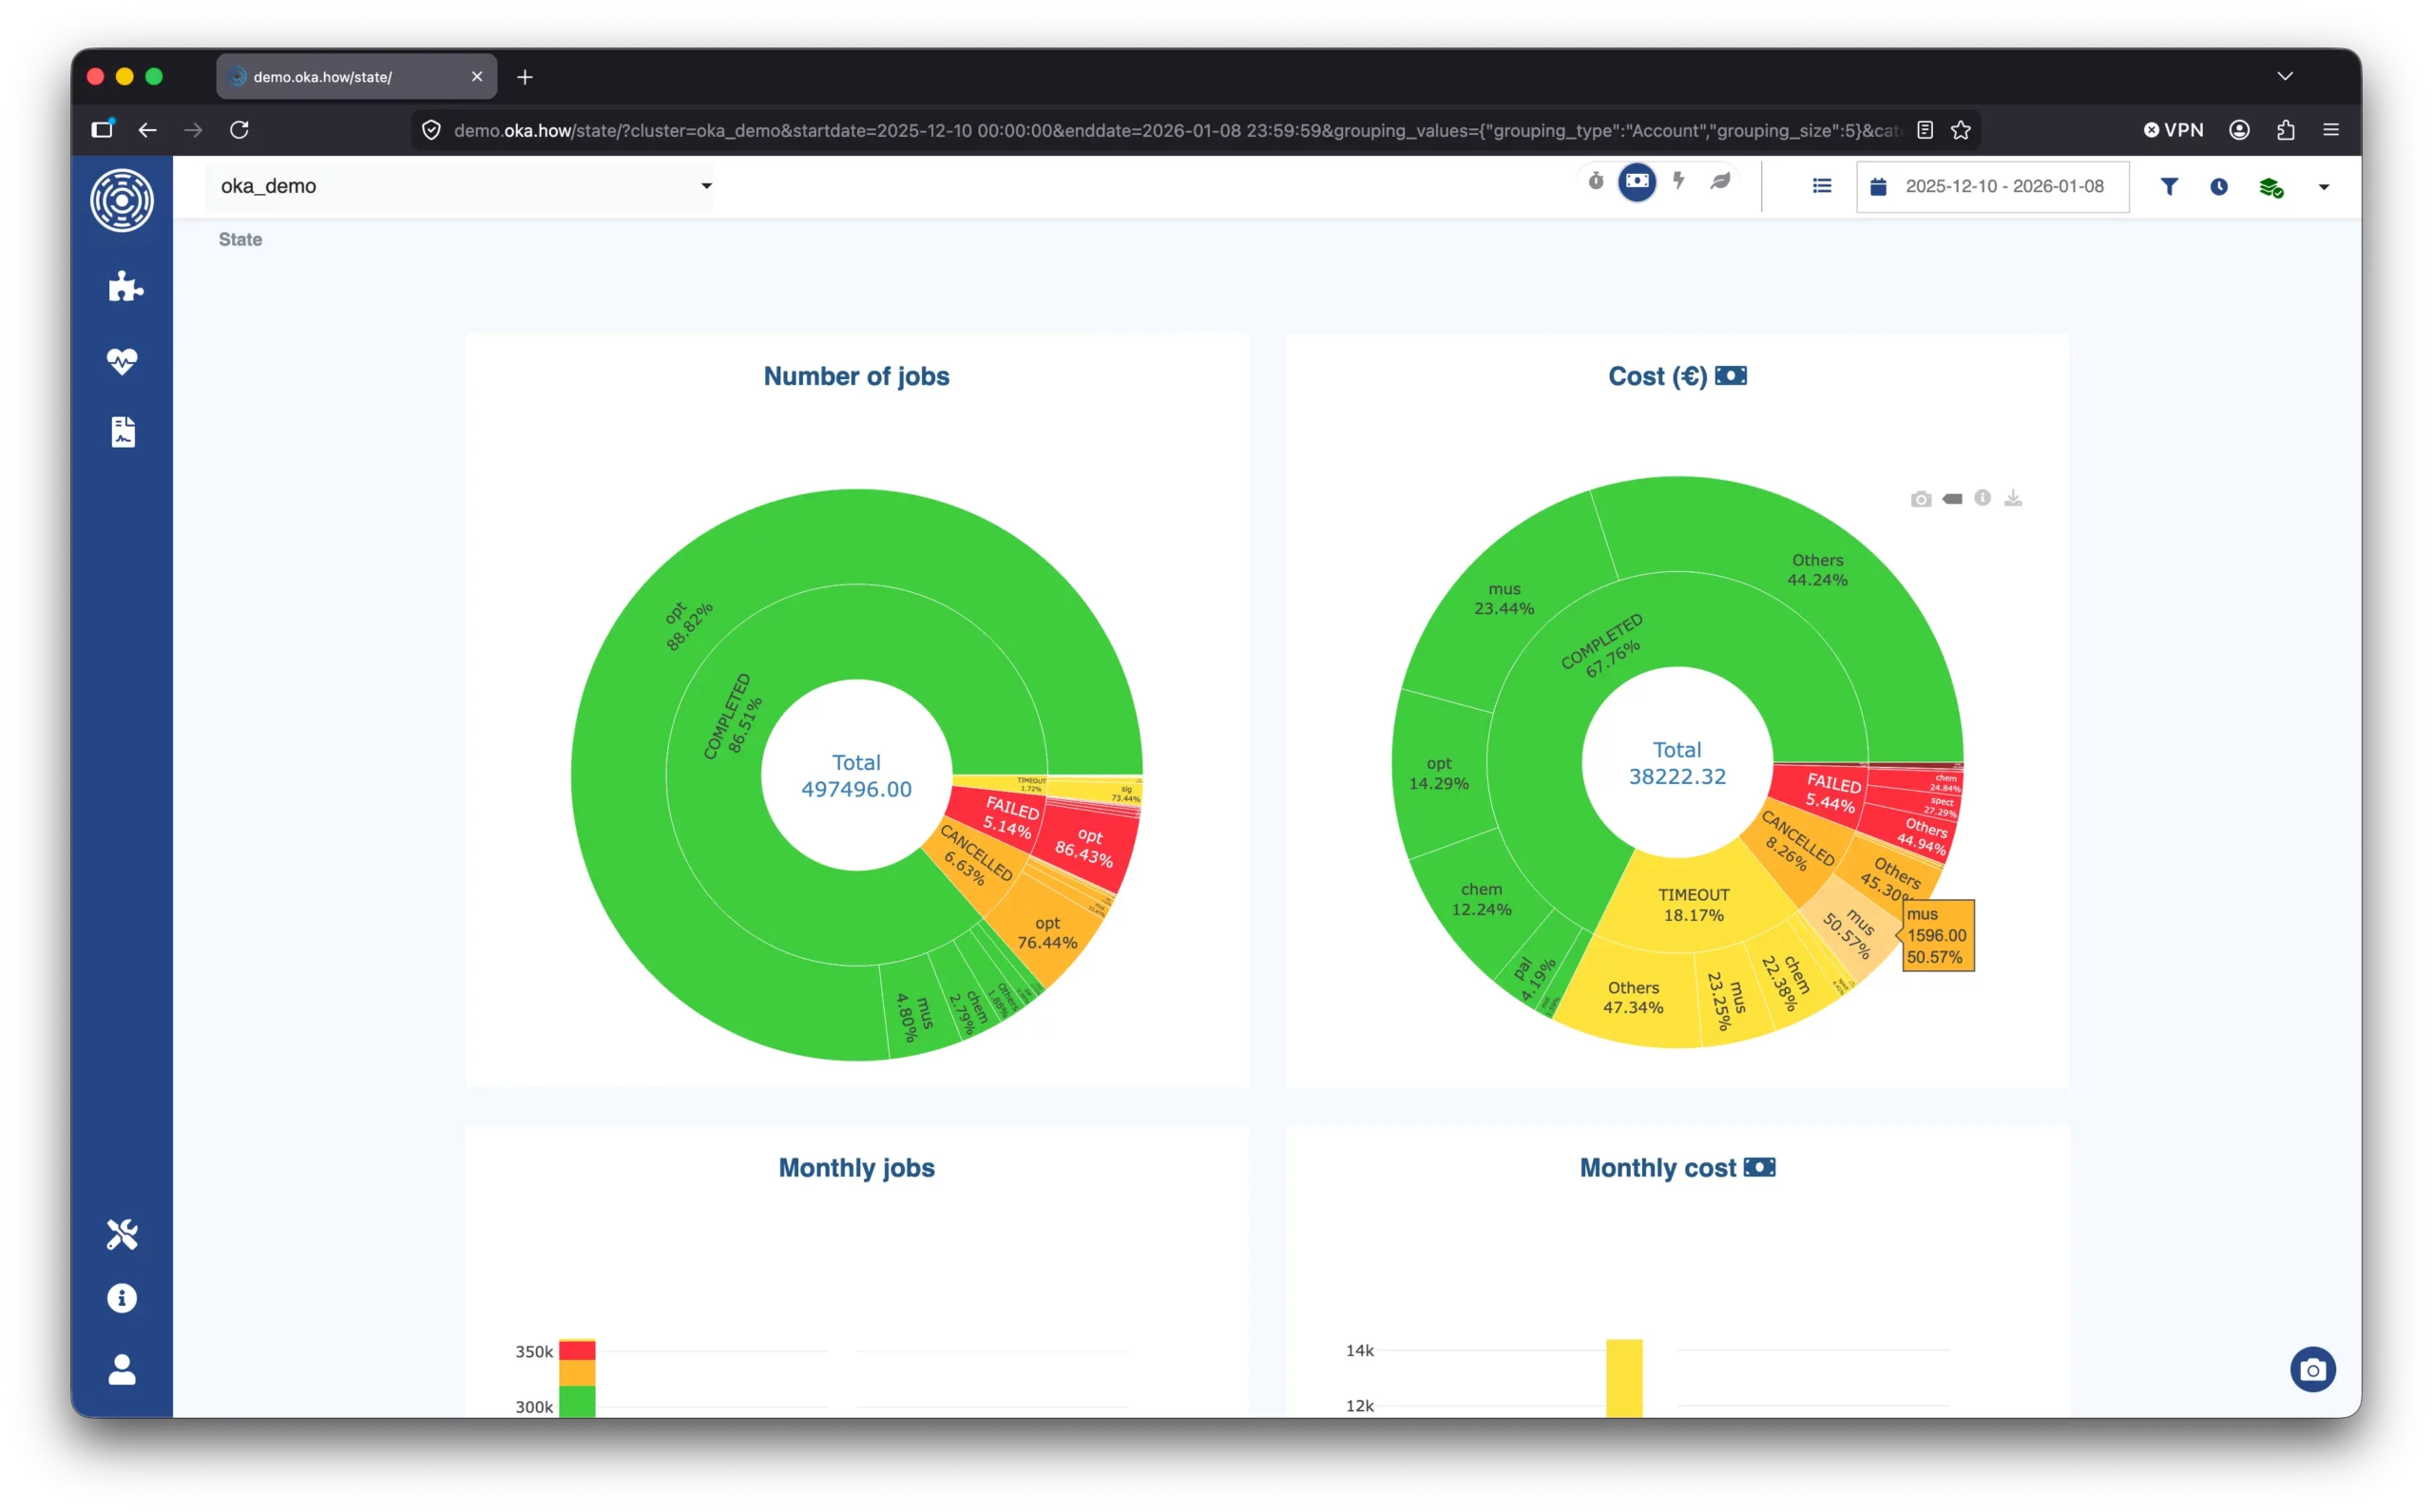
Why this matters. Cost visibility changes user behavior. When researchers can see what their jobs cost, they tend to right-size allocations, avoid holding idle reservations, and shift exploratory workloads to off-peak hours. A chargeback system — even a simple one — is often the single highest-leverage change an HPC center can make to improve overall cluster efficiency.
Cleaning and Enriching Job Metadata: The Misc Toolkit
Analytics quality depends on data quality. The three utility enhancers in the misc/ directory tackle the most common metadata cleanup tasks that every HPC site eventually writes some ad-hoc script to solve. Having them as named, tested, configurable enhancers integrates the cleanup directly into the OKA pipeline.
Normalizing User Names: capitalize_user.py
When multiple scheduler plugins, LDAP connectors, or import scripts coexist, user names can arrive in mixed case — alice, Alice, and ALICE are three distinct values to a GROUP BY query but represent the same person. This enhancer fixes it in one line:
data[self.params.field] = data[self.params.field].str.upper()The target column defaults to the OKA User field but is configurable, so the same class can normalize any string column — account names, group names, or project codes — simply by changing the field parameter in the admin panel.
Exploding Structured Metadata: split_field.py
Many sites encode structured metadata in free-text scheduler fields. A common pattern in the Account or Comment field looks like:
app=namd,nproc=128,cutoff=10,timestep=1.1,numsteps=2500The SplitField enhancer parses this into individual columns:
# Input: Account = "app=namd,nproc=128,cutoff=10"
# Enhancer produces: app, nproc, cutoff
# OKA then automatically prefixes all new columns → Cust_app, Cust_nproc, Cust_cutoff
exploded = data["Account"].str.split(",").explode()
kv = exploded.str.split("=", expand=True)
kv.columns = ["field_name", "field_value"]
split_df = kv.pivot_table(columns="field_name", values="field_value", ...)Once these columns exist in OKA, you can filter by application, group by Cust_nproc, or build dashboards that break down resource usage by scientific domain — all without changing anything in the scheduler configuration.
Parsing Slurm WCKeys: wckeys_split.py
Slurm’s WCKey mechanism lets users tag jobs with a project:software identifier. Many centers use it for fine-grained accounting, but OKA ingests WCKey as a single opaque string. This enhancer splits it:
parts = data["WCKey"].str.split(":", n=1, expand=True)
data["Project"] = parts[0]
data["Software"] = parts[1] if 1 in parts.columns else pd.NARows where WCKey is missing or lacks the separator produce pd.NA in both output columns rather than an error string, so downstream aggregations behave correctly without additional null handling. OKA automatically prefixes the new columns, so they appear in dashboards as Cust_Project and Cust_Software — first-class filter and group-by dimensions available across every OKA view.
Why this matters. You cannot analyze what you cannot query. These enhancers convert opaque text fields into structured, filterable columns. The investment is minimal — typically five minutes of configuration in the OKA admin panel — and the payoff is immediate: richer dashboards, better anomaly detection, and cleaner chargeback reports.
Conclusion: Make OKA Yours
Data Enhancers are what turn OKA from a powerful generic platform into a precision instrument tuned for your cluster. The examples in this library cover the most common enrichment needs across HPC centers:
- Energy measurement via EAR, whether through a direct database connection or through the
eacctcommand-line tool. - Carbon footprint and electricity cost by crossing job energy with real-time French grid data, enabling sustainability reporting and variable-cost attribution.
- Cost accounting through a flexible chargeback model that handles CPU hours, GPU surcharges, and contract discounts — all configurable from the admin panel.
- Metadata normalization to make scheduler fields queryable, filterable, and aggregatable in OKA dashboards.
Getting started is straightforward:
- Browse the repository and identify the enhancer closest to your use case.
- Open Management → Data Enhancers in OKA and paste the code into the integrated editor.
- Test in the sandbox against a real job subset, then publish the draft.
- Assign to your cluster and adjust parameters — pricing constants, database credentials, API keys — directly in the admin panel.
- Run the enhancers pipeline to backfill historical data with the new metrics.
If you build something new, consider contributing it back. The library grows through the collective experience of HPC centers, and a well-documented enhancer you write today might save another team days of work tomorrow.
OKA ships with powerful defaults. The real power is in making it yours.
Questions, feature requests, or contributions? Open an issue or a pull request in the
oka_dataenhancersrepository, or contact the UCit team.